
Introductory physics is the most accessible science class taught in high school. Sure, there are equations. Sure, there is math. But that’s not the point. When it is done right, everything in a first year course can be experienced directly and easily observed. Well, almost everything. Planetary motion and Kepler’s Laws usually get stuck into the middle of the class as a vaguely historical and quickly brushed over link between circular motion and gravity. This unit sets out to correct that by guiding students through the historical narrative of our understanding of the solar system through real and simulated astronomy. The focus is on what students see and the interpretation of those observations through a historical lens. Students will conduct their own observations and develop their own understanding through argumentation, making this unit an inquiry experience.
This unit is designed for a high school physics course in place of the normal treatment of Kepler’s Laws and introduction to gravitation. Students should be familiar with circular motion and forces before they begin. As a mathematical requirement, they should have completed a course in geometry. This topic list makes it a great fit for the AP Physics 1: Algebra Based course, because of its focus on observation, writing and argumentation. Despite its original intent, it is accessible enough to be implemented in any high school physics or physical science course.
The topics addressed in this unit include, but are not limited to, Earth based astronomy, historical evaluations of competing solar systems, geometric argumentation, the development of Kepler’s Laws from observations and the development of Newton’s Law of Universal Gravitation from Kepler’s Laws. Students will be required to make observations and turn their observations into arguments for or against competing worldviews. They will supplement their observations with geometric arguments, the way that Galileo, Kepler and Newton did. There is ample space for presentation, discussion and non-lab projects as well as free resources for simulations that allow students to make their own observations from both Earth-based and “bird’s eye” perspectives.
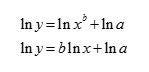
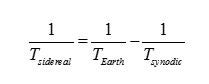
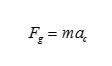
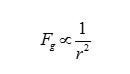
The way I structure my class is designed so that every subsequent topic follows from the previous, with the exception of gravitation and Kepler’s Laws. Introductory physics has the joy of being one of the most conceptually cohesive courses in high school. Think about it – once you get past the language introduced by kinematics and learn how it describes observations, you lay out Newton’s Laws and everything else follows. Momentum, energy and simple harmonic motion are all just extensions of Newton’s Laws. Except, of course, Kepler’s Laws. They form the culmination of the life’s work of multiple brilliant people. Some of these people even died because of the foundational ideas behind them, yet their typical treatment is boiled down to writing them on a board and moving on. It makes them feel out of place instead of important, and this unit seeks to facilitate a set of inquiry experiences so students can experience the intellectual and historical narrative that surrounds Kepler’s Laws. A Note on the Use of Geometry When we think about proofs and derivations, they’re usually carried out symbolically. We’ve been trained to think through things algebraically, and so we’ve trained our students to do the same. This presents one of the biggest fundamental hurdles for this unit. Kepler’s primary sources highlight this well. At their best, his arguments are based around massive data tables that demonstrate trends. At their most challenging, he draws cripplingly esoteric parallels between planetary motion and music theory. Most of the time, however, he makes his arguments from an underutilized middle ground: geometry. Galileo also does this frequently. Even Newton develops calculus from initially geometric arguments. This is weird to follow at first, but is a technique I want students to be able to use to make their own arguments. The first part of the unit, then, will have students doing a lot of diagramming and using geometry to evaluate different solar system models. Linearization When analyzing data, not everything fits in a straight line. This is a bit of a problem, because it’s much easier to extract useful information from linear data sets. If you assume that the relationship expressed by your data is a power function, the natural log can be used to force the function to become linear. Starting with a general power function, We can then take the natural log of both sides. Then rearrange using properties of logs. Now you end up forcing your data to look linear. So when students graph the vs , the data will fall along a line, with the slope of that line being the exponent of the original power function and the y-intercept of that line being the natural log of the coefficient. The process is simple, but is extremely esoteric for students until they’ve had some experience with logarithms. That’s why I typically wait until later in the year to introduce this process, after students are extremely comfortable graphing, fitting lines and interpreting slopes. This process will become key to students determining Kepler’s 3rd law from observations. Earth Based Observation The foundations of astronomy were laid far before our modern understanding of the universe was solidified, so some of the conventions might seem odd. The first thing to consider is how measurements can be made. Holding a ruler to the sky is a pointless exercise, because two observers wouldn’t measure a consistent distance between two stars – their measurement would depend entirely on how far the ruler was held from their eye, not to mention that describing the distance between two things that are very far away in inches is entirely meaningless! To combat this, stellar measurements are done using angles. The angular separation between two stars, for example, would be the angle between them, taking the observer as the vertex. The next step is to consider how an early understanding of the universe led to the coordinate system that’s used. The early perception was that Earth sat in a fixed position in space, with the sun orbiting around it. Since the configuration of the stars appeared static through time, they were referred to as the fixed stars, in the sense that their position was fixed relative to the other stars. These stars can then be thought of as affixed to an enormous sphere, known as the celestial sphere, which has a coordinate system attached to it that is similar to the latitude and longitude we use to measure positions on the Earth’s surface. This celestial sphere is rooted in the Pre-Copernican idea of a geocentric universe, where the Earth sits motionless at the center and everything else orbits around it. This sphere spins around an axis that goes through the Earth’s poles and has an equator projected from Earth onto it. This convention leads to a coordinate system that is analogous to latitude and longitude. Angular distance above or below the celestial equator is called declination, which is comparable to latitude. The other angle used to locate a point is known as the hour angle, which compares to longitude. For some of the simulations this unit uses, the similar right ascension is used. Both refer to an angle east or west of a meridian on the celestial sphere. The rotation of the celestial sphere does a great job of explaining the observed motion of the stars, but didn’t quite cover everything. Specifically early astronomers noticed stars that appeared to wander in the sky. The Greeks dubbed these asters planetai, or wandering stars. These planets would move across the sky from night to night, out of sync with the rest of the fixed stars. Most of the time, they traveled faster, creeping westward over time. Sometimes they would slow down, or even appear to reverse direction, in a motion known as retrograde. The motion was well documented, but the reasoning was not known. A simple geocentric model with circular orbits and a rotating celestial sphere could not account for the motion of these wandering planets. A geocentric worldview would persist, however, cemented in place by the Catholic Church. Complex orbits were calculated for the planets, called epicycles, which resembled Spirograph drawings. These predicted retrograde motion accurately, but were hard to understand and had no underlying mechanism that justified their existence. It took until the near death of Copernicus to finally publish a competing worldview – a heliocentric model where the Sun was at the center of our solar system and all planets orbited it in perfect circles. It was simpler and more accurate than the geocentric model, and the Earth’s movement naturally accounted for some of the tough to reconcile observations, like retrograde motion. Tycho Brahe, in an effort to settle arguments, took extensive and dedicated measurements of celestial objects. His enormous dataset eventually allowed his assistant, Johannes Kepler, to reconstruct the orbit of Mars and develop his three laws of planetary motion. Getting access to this same enormous dataset may have also inspired Kepler to murder Brahe via mercury poisoning, but independent of the quality of his character, the magnitude of Kepler’s work is undeniable. Kepler’s First Law said that planets don’t orbit in the circles predicted by Copernicus, but instead in ellipses, with the Sun at one focus. His Second Law outlined that planets speed up when they are closer to the Sun, thereby sweeping out “equal areas in equal times.” The third established a relationship between the period of an orbit, T, and the semi major axis of that orbit, a, such that: Newtonian Gravity Kepler’s work directly led to Newton’s Law of Universal Gravitation. After publishing his laws of motion, Newton was led to realize the relationship between the gravitational force and the distance due to Kepler’s 2nd Law. Seeing that a radial force was required to keep objects in an elliptical orbit, Newton deduced that: This was enormous! It brought gravitation as we experience it on Earth in line with gravitation as observed in space. This relationship set the stage for astrophysics to come and the disagreements between the theory and observation were the window Einstein needed to develop his theory of Relativity. This rich historical and intellectual narrative in physics is what I want my students to experience. The unit is initially designed for my 11th grade Advanced Physics classes, which meet five times per week for 48 minutes per day, to complete in around three weeks. Students are expected to have taken geometry and been exposed to logarithms in order to complete the activities. My students are incredibly diverse in every imaginable way, so their prior experience and knowledge about the solar system is equally varied. My school attracts students from every middle school in the Philadelphia School District, so there is little consistency in their science education before they get to us. Therefore, this unit assumes zero prior knowledge about the structure of the solar system or the relative sizes and arrangement of the bodies that make it up.![]()
![]()
![]()

The objectives of this unit can be broken up based into a few broad categories. Observationally, I want my students to predict the observed motion of both inferior and superior planets in geocentric and heliocentric solar systems. Before they go looking at motion, I want them to have an idea of what they are looking for and what different observations will signify. After they’ve predicted what they may observe, I want them to reconcile observed motion with predicted motion to accept/reject possible solar system configurations. Finally, my students must identify how limitations of simplified models manifest themselves in observations. In terms of quantitative observations, my students must observe and quantify planetary motion to determine the orbital period of planets (convert from synodic to sidereal period). This gives them the foundation to determine the true period of a planet’s orbit. As an attempt to model how distances to planets were measured, I will also have my students use parallax to measure distances to far away objects. This will take place in the city setting, with students determining the distance to far away buildings. To determine Kepler’s Laws and Newton’s Laws from their observations, my students will graph and linearize data to determine the relationship between orbital radius and orbital period. This will be done using given orbital distances, leading students to essentially determine Kepler’s 3rd Law from a data set. To test what they determine, they will then use Kepler’s 3rd law to determine the orbital distance of unknown planets from simulated observations. Finally, they will use Kepler’s 3rd law and Newton’s 2nd law to establish the inverse-square relationship for gravitation.
The two major strategies that my students will develop are observation and argumentation. For my students, it’s very easy for them to get ahead of themselves. They don’t frequently want to discuss what they see; they instead want to give correct answers. This unit has been designed to constantly ask students what they see and what that tells them. Specifically, along the way, the answers won’t always be what are commonly accepted as scientific fact. By examining observations through a historical lens, students should gain an understanding of the thought process and work that got us to where we are today. To make this happen, students need to communicate only what they actually observe, which will be a challenge for them. To help, they’ll have computer simulations to make observations from, so if they miss something, they can rewind and review. After they’ve observed, students need to decide what it is they are seeing and persuade people to agree with them. They’ll do their argumentation predominantly through writing and geometry. The challenge will again be having students ignore their prior knowledge and assemble their conclusions from just what they observe. Carefully crafting questions and reminding students of historical context will be necessary to keep what they already know out of their arguments and justifications.
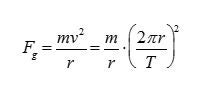
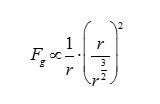
Activity 1: Observing the Sky – (2 Days) To begin, I want my students to have a sense of what observing and taking astronomical data is actually like. One of the challenges for my students is that we live in Philadelphia, so light pollution is a huge barrier to observing the night sky. Many of my students have never seen a dark sky full of stars in their entire life, so I’ve frontloaded the unit with this activity, designed to simulate the experience of observing the night sky. I’ll show pairs of students an image of a portion of the night sky and ask them to describe the things they can see. If they know what any of the objects are, I’ll also allow them to identify them by name. The picture will contain the moon, a major constellation and Venus, so there’s a possibility they could know something. After they’ve identified everything they can, I’ll give them an image of the same sky, taken 24 hours later, and ask the same questions. At this point, students will also be prompted to identify what is different. A third image, taken 48 hours after the original, will be provided to them. By this time, students should have a pretty strong feeling that, on a day-to-day basis, not much changes besides the Moon. For the next part, I’ll present them with a set of three images of the same sky, each photo taken a week apart, and pose the same questions. Students should spend some time hunting through the images and realize that there is one dot that’s moved (Venus) and the Moon has also changed its phase. Now I want them to think about what they could measure from these observations. After they’ve agonized over some actual photographs, they will spend some time with a computer simulation. David Calarusso has assembled an awesome simulation that this unit will make extensive use of, but for this first activity, just show students the simulated solar system observations on the main page of his site. If you turn the time down to 0.0027 years/frame, each frame will be one day and a month’s worth of observations will fly by in just under a second. I’ll have students step through the frames one at a time and observe how little the naked eye planets shift with each step. They’ll run the simulation and see how the months fly by while the changes in position for planets like Jupiter and Saturn barely budge. After they’ve started to comprehend the laborious reality of observation, solicit student responses for what they saw change over time. They should describe the motion of celestial bodies and the phases of the moon. Finally, I’ll ask students what types of measurements they could make. They should be able to identify relative position and brightness. I’ll wrap up the day by asking them to write a paragraph justifying how long they would have to observe the sky for to get a good set of data about the motion of Saturn. Activity 2: Evaluating Solar System Models – (3 Days) After giving some direct instruction on the historical context of different solar system models, I want my students to objectively evaluate them. For them, they need to decide if the theory fits with the observations. From the simulation used in activity one, students should be familiar with retrograde motion, which will be a key factor in deciding between the theories they evaluate. Specifically, I want them to think about geocentric models (with and without epicycles) and heliocentric models, each with and without a rotating Earth. Their first day will involve evaluating each model using a geometric approach. Students will work individually and their eventual output will be a series of diagrams with written descriptions that form an argument for or against each model. As an example, some of the illustrations in the works of Galileo and Newton demonstrate the effectiveness of geometric argumentation in a physical and mathematical context. These arguments and drawings will be critiqued and discussed in class, with students taking positions for or against different systems. The second and third days will have students create models of these different solar systems. To do this, groups of students will act out the models in open spaces like the gymnasium or a park while one student acts as “Earth” and films with a cellphone camera held at their chest. This should be pretty straightforward for everything except a geocentric model with epicycles. I’ll suggest to my students that they for each planet, they have two students and a length of rope. One student will be the planet and the other will just track their position along the orbit. At each step, the student on the orbit moves forward, while the student playing the planet advances around them and maintains tension in the rope. The videos from each scenario will then be compiled and viewed. Once my students have the videos, they need to watch them and evaluate them. First they should check to see if they agree with their geometric predictions. If they do not agree, students should be prepared to answer why by identifying an error in either their filming methodology or their geometry. Secondly, students will need to evaluate if what they see in their videos reflects what’s observed from Earth. They are free to reference the simulation from the previous activity to verify. From these exercises, students should be prepared to provide a written evaluation of the competing solar system models and decide on what they accept based on geometry, simulation and observation. Activity 3: Measuring Distances Using Parallax (2 Days) Once students are convinced that the Earth moves around the Sun, we can start to use that fact to better understand how distances are measured in space with parallax. We do this over two days, with one day for direct instruction and a small-scale indoor activity and one more for a large-scale outdoor activity. For the outside activity, you’ll need to construct a device that students can use to measure angular separations. I’ve created budget goniometers by taping a piece of string to the origin of a protractor and feeding it through the slot near the outer rim. After laying down some theory and practice about parallax, students will use the technique to measure the distance to an object in the lab. To do this, I tape down a single piece of graph paper at one end of a lab table and put an object on the other end. For objects, essentially anything will do. For the activity, students use the gridlines on the graph paper to line up the object. They then count over a number of squares to create a baseline and take a protractor to eyeball and measure the parallax angle. Using a bit of trigonometry, students can calculate the distance. I typically set up a bunch of stations and require students to complete at least five of them during a class period. The actual distances for each station will be written on index cards and hung on the wall so they’re hidden until students are ready for them. They then finish their calculations and determine percent error between their measurement and the actual distance. On our second day, I have my students go outside with their makeshift goniometers and use parallax to determine the distance to the statue of William Penn on the top of City Hall in Philadelphia. The instruction sheet is attached in the appendix. What I have my students do is work together as an entire class to compete against other class periods to determine the best measurement of the distance from our school to the statue. It requires one student to use a surveyor’s wheel to measure the distance of the baseline and for students to use the buildings and streets of Philadelphia like a piece of graph paper to serve as a reference for the measurement of angles. I’d have students report their calculations in a Google Form so that I can quickly average their results in a spreadsheet and determine which period was closest to the actual value. My typical incentive for precision is not having to write a lab report if you’re the closest, so I’d extend this luxury to the entire class period that won, though they’d still be responsible for turning in measurements and calculations. Activity 4: Kepler’s 1st & 2nd Laws (2 Days) Kepler devoted an enormous amount of time to reconstructing the orbit of Mars from Tycho Brahe’s data in order to come up with his 1st and 2nd laws. While I typically have unbelievably high expectations for my students, this is beyond the reasonable scope of a high school physics classroom. In order to start coming up with Kepler’s Laws, my students will use an online tool called Gravity Simulator to observe orbital motion. They’ll start with a task list that includes varying the masses, distances and initial velocities of orbital bodies and then make a series of observations about the shape and speed of those orbits. Students should gain the idea that the orbits are elliptical and the closer the orbiting object is to what it’s orbiting around, the faster it travels. After they gain a qualitative understanding, I want them to begin to quantify their results. Students will start by using another planetary motion simulator to pin down how this speed changes. Students will start by taping a clear sheet protector over their computer screen and making a dot with a dry erase marker on top of the Sun. They will then follow around a planet making dots at equal time intervals. The spacing of the intervals depends on the planet they’re following, but I’ll have them start with Earth and two month intervals. Once they’ve done that, they’ll slide a piece of graph paper into the sheet protector, connect each point to the Sun and use the graph paper to estimate the area inside each segment of the ellipse. Students should complete this task for three different planets to verify that the areas are the same. Activity 5: Kepler’s 3rd Law: (3 Days) This is one of the major activities of the unit and it involves a fair amount of potentially new data analysis skills, so some time has to be spent focusing on graphing and data analysis. I typically teach Excel and spreadsheets as an analysis tool much earlier in the year, but this is the point when I’ll first introduce the natural log based linearization technique that I explained earlier. It fits especially well, because Kepler’s 3rd Law is a power function. Students can then graph the natural log of the period against the natural log of the average distance to determine the relationship between them. In order to make sense of the next part, we need to make sense of periods. Since the Earth moves through space as we make our observations, our frame of reference is constantly shifting. That makes trying to measure another planet’s position in its own orbit extremely hard. As such, trying to directly measure when another planet has completed one full trip around the Sun is also out of the question. This amount of time, known as the sidereal period, needs to be calculated from something we can observe directly. From our position, all we can really do is observe the configuration of stars and planets, and then use geometry to make inferences from that information. Because of this, it’s much easier to measure the amount of time it takes for the Sun-Earth-Planet system to return to the same configuration. This time, called the synodic period, is either shorter or longer than the planet’s actual sidereal period, depending on if that planet is closer to the Sun or farther from the Sun than we are. To have my students do this, I want them to discover the relationship between distance and period from observations. Going back to David Calarusso’s simulation, students will measure the synodic period of a planet by measuring the time between conjunctions. A conjunction occurs for a particular planet when the Sun is in between that planet and the Earth. In the simulation, this is really easy to measure by determining the time separation between two successive overlaps of the sun and the planet. In reality, this is harder to measure; so early astronomers used something called opposition, which is when the Earth is between the planet and the Sun. This synodic period can be converted to a sidereal period to determine the number of years it takes a planet to orbit the sun. For inferior planets, the relation is: For superior planets, we use: In both relations, since we use the unit of Earth years, . Once students have determined the sidereal period for each visible planet, they’ll take a list of average distances to these planets (in terms of the Astronomical Unit) and graph a linearized data set to determine an equation for the relationship between the period and distance. After students have a relationship they feel confident in, they’ll be given a URL and password for another simulated solar system. Here, they’ll use their equation and measured sidereal periods to determine the average distance to each of the planets. Students will be evaluated on the percent difference between their determined values and the set distances in the simulation. One of the great things about David Calarusso’s site is that you can specify all the parameters of a simulated solar system and give different systems to different classes or students. Activity 6: Newton’s Law of Universal Gravitation (2 Days) Even though Newton based his understanding of gravity on Kepler’s 2nd Law, we can get there starting from uniform circular motion and Kepler’s 3rd Law. Students should derive a relationship between the gravitational force, , and the distance, . To do this properly, start by assuming circular orbits. Substitute for centripetal acceleration and then for the tangential velocity. Now, using Kepler’s 3rd Law, replace the period with , move down to proportionality and drop all of the constants. After a little bit of cleanup, you’re left with the most important piece of Newton’s Law of Universal Gravitation, the inverse square relationship. At this point, students should test to see if the theory fits their observations. A computer model called Gravity Simulation will actually let you change the way the gravitational relationship works, but allowing you to set the gravitational force to be any function of r that you select. Have students begin with the relationship they determine in the previous part and see if the observations they make in the gravity simulator seem correct. Then, have them vary the relationship and see what produces elliptical orbits. Students should then end the activity with a mathematical “proof” of their theory and observations that support it. Their final assessment of it will be a written assessment of the agreement between their theoretical and experimental work. Activity 7: Final Project (2 Days for Presentations) Usually I like to end my units with some sort of engineering challenge that uses whatever my students have been learning. For this unit, that won’t work quite as well. That doesn’t mean I can’t have my students produce anything, so I want them to take what they’ve discovered and learned about our solar system and turn it into a marketing campaign that attempts to persuade nonbelievers that our current picture of the solar system is the one that correctly fits observation. A big component will be appealing to the arguments posed by modern flat-Earthers and geocentrists. Students will be in groups of three. Their task is to produce a comprehensive marketing campaign that consists of a video component, a multi-page text based component and a single page visual component. I envision these as an infomercial, an informational pamphlet and a poster, but students will have the freedom to interpret these components as they see fit. They will be assessed on quality of argumentation and the overall presentation of the different components. The final piece of the project will be to deliver a marketing pitch to the class that shows off all of their work and evaluates the impact they expect their materials to have. This should be structured like the students are bidding for a marketing contract. Students will be evaluated on factual correctness, argumentative quality, quality of products and quality of presentation. Endnotes Since the historical context for this unit is rooted in the discovery and dissemination of new (and controversial) ideas, students should be prepared to discuss and defend their results in front of peers. Science is reconciling observations with explanations. To truly learn it, students should have that experience in the classroom. All too often it’s just easier to tell our students things and have them repeat them on an exam or a homework assignment. Giving them the space to learn, discuss, understand and fail is much more challenging for everyone involved, but leads to a more authentic and memorable learning experience.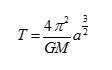

Reading List Feynman, Richard P. The Feynman Lectures on Physics, boxed set: The New Millenium Edition. New York: Basic Books, 2011. Print. Feynman’s approach to physics education is legendary and one of my biggest inspirations as a teacher. He felt that if you couldn’t explain a topic to a first year physics major, you didn’t understand it well enough. I invested in the fancy hard bound version, but the first volume covers everything you’d want for a high school physics class, including a great chapter on gravitation. Galilei, Galileo. Dialogue Concerning the Two Chief World Systems. Ed. Stephen Jay Gould. Trans. Stillman Drake. New York: The Modern Library, 1953. Galileo wrote this book as a hypothetical dialogue between three people, a heliocentrist philosopher, a geocentrist philosopher and a neutral layperson. The book progresses as a series of discussions about Earth and Sun centered models of the solar system, forming a narrative and geometric argument for valuing the Copernican model over the Ptolemaic. Goodstein, David L., and Judith R. Goodstein. Feynman’s Lost Lecture. New York: W. W. Norton & Company, 1996. Print. My copy of the book came with an audio version of the lecture. It’s a lecture Feynman gave on why Kepler’s First Law follows as a necessary consequence of the Second and Third. Since it didn’t receive the level of polish that the talks in the Feynman Lectures on Physics did, it’s not as well presented. He only uses what he calls “elementary geometry” to demonstrate this, but it’s still dense. Kepler, Johannes. “Harmonies of the World: Book Five.” On The Shoulders of Giants: The Great Works of Physics and Astronomy. Ed. Stephen Hawking. Philadelphia: Running Press, 2002. 627-723. Print. This gives insight into just how much work was required for Kepler to arrive at his theories as well as the unconventional insights that early scientists needed to make in order to understand the world. In this particular volume you can see how Kepler took his knowledge of music theory and used it to inform his understanding of Tycho Brahe’s observations. Newton, Isaac. Mathematical Principles of National Philosophy. Trans: I Bernard Cohen and Anne Whitman. Oakland: University of California Press, 1999. Print. There are two translations of Newton’s Principia, so make sure you get the version translated by Cohen and Whitman. This particular version is readable, the other translation is a mess. Newton’s Principia provides geometric arguments for the development of calculus and his Law of Universal Gravitation. The diagrams, in particular, are quite intuitive and should help inform your instruction. Student Resources Astronomy 161: The Solar System. <http://csep10.phys.utk.edu/astr161/lect/index.html> These are the lecture notes from a University of Tennessee introductory astronomy course that focuses on the historical development on our understanding of the solar system. Classroom Materials Gravity Simulator. <http://www.testtubegames.com/gravity_full.html> A gravity simulator that runs with varying quality on different systems. The main feature is that it allows you to change the relationship between the gravitational force and distance and load preset solar systems from a code. The full version is a paid download with a generous license that is worth installing on school computers. Gravity and Orbits. <https://phet.colorado.edu/en/simulation/legacy/gravity-and-orbits> Free Java-based gravity and orbit simulation. My Solar System. <https://phet.colorado.edu/en/simulation/legacy/my-solar-system> Free gravity and orbit simulation that runs especially well on Chromebooks. Simulator online revolution orbits of the planets – Astronoo. <http://www.astronoo.com/en/articles/positions-of-the-planets.html> Despite the weird name for the website, this is a good “birds eye view” simulation of the solar system. Wandering Stars – How to Calculate the Positions of the Planets. <http://www.davidcolarusso.com/astro/> This is the homepage for an irrationally great Earth-based observation simulation. It forms the basis of many of the activities in this unit. http://www.nowykurier.com/toys/gravity/gravity.html. <http://www.nowykurier.com/toys/gravity/gravity.html> Very simple (graphically) but very cool gravity and orbit simulator. It generates proto discs and has masses combine upon collision. I prefer it to the PhET simulations, but my students don’t. Probably better for demonstrations or advanced students.
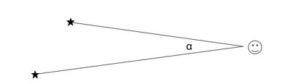
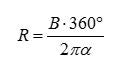
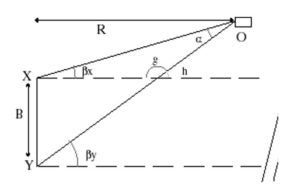
Activity Materials The following document is a copy of the lab handout that I will use for the parallax activity. If you can adapt the description of the assignment to fit your situation, the instructions, theory and equations should be extremely helpful to you and your students. Parallax Across Town Today we are going to measure the distance to the Statue of William Penn on top of City Hall. Outside, we are lucky that the city is essentially covered in graph paper- because 11th St and 12th St are parallel! Unlike the graph paper on the table, however, the target object will not line up exactly with the 11th or 12th street from viewpoint X. As a result, we must use a little geometry to find our angle a by measuring the angles between the parallel lines (or streets) and the target object at both locations X and Y. Measure bx, the angle between the target and the street at position X. Then go to viewpoint Y and measure the angle by between the target and the street at that position. Looking at Figure 2 and remembering that the angles in a triangle must add to 180°, we see that g = 180° – a – bx . Since g + h = 180° (because they make up a straight line), we can substitute h = a + bx . But then, looking at the figure, and using what we know about parallel lines h = by . So then, substitute for h in the two equations above, and do a little rearranging, and we find α = by – bx . So the parallax angle α is just the difference between the two angles b that you measure between the target and the very distant reference object. Once you find α, you can use the equation from before to find the distance: You are working together as a class to come up with the best estimate of the distance to the Statue of William Penn on top of City Hall! As a class, everyone should take measurements, perform the calculation and average their results. Help each other! The class with the closest estimate doesn’t have to write a lab report- but you have to contribute your results to the class average to get credit! Figure 2.Name: ___________________________________________ Period: __________
Care has been taken to design this unit to fit thematically within the content of an introductory physics course. In addition, the activities outlined are aligned with national and state standards for teaching and learning, which are referenced below. PA Science Standards Pennsylvania has its own set of science standards, and this unit specifically addresses: 3.2.P.B1. Differentiate among translational motion, simple harmonic motion, and rotational motion in terms of position, velocity, and acceleration. Use force and mass to explain translational motion or simple harmonic motion of objects. Relate torque and rotational inertia to explain rotational motion. 3.2.P.B2. Explain the translation and simple harmonic motion of objects using conservation of energy and conservation of momentum. Describe the rotational motion of objects using the conservation of energy and conservation of angular momentum. Explain how gravitational, electrical, and magnetic forces and torques give rise to rotational motion. Next Generation Science Standards Many states have already adopted the Next Generation Science Standards, which are organized based upon a number of different practices. This unit directly addresses the following standards: HS-PS2-1. Analyze data to support the claim that Newton’s second law of motion describes the mathematical relationship among the net force on a macroscopic object, its mass, and its acceleration. HS-PS2-4. Use mathematical representations of Newton’s Law of Gravitation and Coulomb’s Law to describe and predict the gravitational and electrostatic forces between objects. HS-PS3-1. Create a computational model to calculate the change in the energy of one component in a system when the change in energy of the other component(s) and energy flows in and out of the system are known. HS-PS3-2. Develop and use models to illustrate that energy at the macroscopic scale can be accounted for as a combination of energy associated with the motions of particles (objects) and energy associated with the relative position of particles (objects). HS-PS3-3. Design, build, and refine a device that works within given constraints to convert one form of energy into another form of energy. In addition, on the topic of Reflecting on the Processes of Science and Engineering, the authors of the standards state: Engaging students in the practices of science and engineering outlined in this section is not sufficient for science literacy. It is also important for students to stand back and reflect on how these practices have contributed to their own development, and to the accumulation of scientific knowledge and engineering accomplishments over the ages. Accomplishing this is a matter for curriculum and instruction, rather than standards, so specific guidelines are not provided in this document. Nonetheless, this section would not be complete without an acknowledgment that reflection is essential if students are to become aware of themselves as competent and confident learners and doers in the realms of science and engineering.