
According to the Everyday-Green web site, “each year Americans throw away more than three billion batteries. That’s about 180,000 tons of batteries. More than 86,000 tons of these are single use alkaline batteries…[a]bout 14,000 tons of rechargeable batteries are thrown away in the United States.”
Unlike most of the trash that winds up in a landfill, batteries are hazardous waste. They contain a number of heavy metals, such as mercury, nickel, cadmium, and lead, which can pose significant health risks. Batteries also contain corrosive materials.
This unit will address the question of what waste is by examining the materials in the batteries we “throw away” and will consider alternatives to disposal in a landfill.
It is a simple application of the Law of Conservation of Mass: you cannot get rid of anything. This concept is regularly taught in science classes but often fails to be internalized by students…or the population at large. So, what happens to the stuff we throw away? Out of sight is out of mind, so why should we be concerned? Consider the following claims: Much of our waste is toxic. Landfills are running out of space. Landfills leak and are contaminating the environment. Incineration produces even more toxic waste and is unregulated. Only a fraction of recyclable materials is being recycled. We produce too much waste as it is, and the amount is increasing. One goal of this unit is to enable students to identify resources that they will use as they investigate the problem of waste generation and removal. In particular, I am interested in aspects of the problem that are especially local in scope and upon which students may have an immediate impact. For example, the School District of Philadelphia has not implemented procedures for the collection of recyclables, and much of these materials wind up in the trash. Additionally, the proliferation of personal electronic devices (notably, Smartphones) and the regular replacement underscore the need for an understanding of the “lifecycle” of materials and the consequences of indiscriminate disposal methods.
Students will be able to
This unit will be inquiry-based. The characteristics of the topic lend themselves well
to this approach. It involves a real world problem that is open-ended, and it is
student-centered. Students will help to define the scope of the problem and will generate a list of questions that focus on the important aspects and applications of
the problem. Furthermore, they will work in teams to resolve issues and achieve the overall learning objectives while each student performs a particular role in the team. Student performance will be determined by the team members and by self-assessment using questionnaires and rubrics. For examples, see http://bie.org/objects/cat/rubrics and http://bie.org/objects/cat/student_handouts.
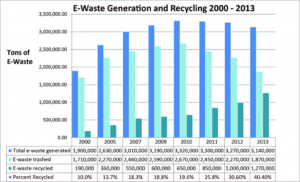
What is trash? Overview Students will examine the contents of a bag of trash from a classroom. Students will produce two charts that identify which items are recyclable and which ones are not. They will make measurements of mass and volume (compressed and uncompressed) in order to determine how much space in a landfill the trash might take up, and then they will extrapolate to estimate how much trash the school produces each day. Materials Procedure Discussion Students should discuss how much of a typical trash bag might be recyclable and should be encouraged to think of other ways to handle the items found. The three R’s of waste management should be considered: Reduce, Reuse, and Recycle. The EPA provides a number of resources for students and educators on this topic at https://www.epa.gov/recycle. Follow-up An interesting follow-up activity, although geared to a younger audience, has students “design, build, and test” a landfill (see Teach Engineering, 2010). Students will take a field trip to a nearby landfill[1] and/or recyclable materials processing plant[2]. What is E-waste? Overview In the U.S., E-waste represents 2% (by weight) of the trash in landfills but 70% of the toxic waste.[3] Recycling of E-waste has reduced the amount winding up in landfills. Still, “about 60% of discarded electronics end up in the trash”[4]. Source: http://www.electronicstakeback.com/ designed-for-the-dump/e-waste-in-landfills/ Not all E-waste is toxic. It is widely noted that because “cell phones and other electronic items contain high amounts of precious metals like gold or silver – each year, we dump cell phones containing worth over $60 million in gold and silver.”[5] In this activity, students will examine the problem of E-waste, starting from their reflection on the types of electronic devices that they personally use and what happens to these items after they are done with using them. Then, students will examine a series of statements about the extent of E-waste in the U.S. and around the world (e.g., see 20 Staggering E-Waste Facts below). They will select one of these “facts” and find verification from a reputable source. In a later activity, students will produce an infographic illustrating the information. Materials Procedure Discussion This activity introduces students to the scope of the problem of electronic waste and presents multiple perspectives on the handling of E-waste. The list of “facts” about E-waste is reproduced from the Earth911 web site. Additional Facts and Figures on E-Waste and Recycling are available from the Electronics TakeBack Coalition (2016) and DoSomething.org.[7] As students seek confirmation of the information contained in their “fact”, they will need to consider the reliability of their sources. There are several good introductory guides on evaluating Internet sites. For example, one, from the University of Illinois[8], asks students, “How did you find the website?” Often, in response to a question on their sources, students will reply, “Google” or Wikipedia. As the guide points out, “the accuracy and/or quality of information located via a search engine will vary greatly.” In the guide, students are asked to also examine the web site’s domain for clues on credibility as well as other indicators such as Authority, Currency, Functionality, Accuracy and Objectivity. It is doubtless that students will need practice on this topic, which could be a lesson in and of itself. Follow-up Two of the succeeding activities will ask students to perform calculations in order to check the veracity of the statements and to create and present an infographic. 20 Staggering E-Waste Facts Source: Battery Science Overview The heart of most portable electronic devices is a battery. There are a wide variety of battery types, but essentially, in a battery, chemical potential energy is converted into electrical energy. There is also a plethora of information on how to make a battery using simple materials. One easy example involves electrodes made from two dissimilar metals (e.g., two different types of coins, a piece of copper wire and a piece of aluminum wire, etc.) and uses a lemon, cola, or even salt water as an electrolyte. There are literally scores of videos demonstrating this technique. In this activity, students will test different electrode materials using lemons and measure the voltage produced using a digital multimeter. Then, they will select a battery described on Instructables.com or another web site, build, and test the battery they produce. Materials Procedure Discussion This is a relatively simple activity, but care must be taken that students do not attempt anything that is dangerous, expensive, or time-consuming. There are several interesting videos that describe how batteries are recycled available online. One, Why Can’t You Throw Away Batteries? (available at https://www.youtube.com/watch?v=sdAme_Nw7qM) is notable in that it is rife with factual errors. For instance, the video discusses alkaline batteries but talks about recycling lead and neutralizing acid. Another video (available at https://www.youtube.com/watch?v=CLXOngR2gRU) illustrates the process of recycling alkaline batteries but has no narration. A longer (almost 26 minutes) video (available at https://www.youtube.com/watch?v=lMn-sDvgj4Q) looks at the process in great depth. Follow-up The issue of recycling batteries is taken up in the following activity. All the batteries on earth can store only ten minutes of the world’s energy needs. – Isador Buchmann (2011) Overview The quotation cited above is provocative in several ways. For example, what is the world’s energy needs? How many batteries are there on earth? Certain questions are the epitome of intractability, in which the answers are often based on incomplete, even unattainable information and represent, at best, estimates that may be correct only within an order of magnitude. Enrico Fermi was famous for such “back-of-the-envelope” calculations, which are even sometimes referred to as Fermi problems. In his classic work, Consider a Spherical Cow[10], John Harte demonstrated numerous examples of solving environmental problems in order to “arrive at an approximate solution” (p. xiii). Problem solving in high school chemistry classes is usually approached through dimensional analysis, in which units of measurement are converted from one unit to another. As an exercise, students will be provided with certain “facts” in order to check the veracity of Buchmann’s assertion. According to the International Energy Agency (2015), the total world energy consumption in 2013 was 13,541 Mtoe[11] (p. 6). A megatoe (Mtoe) is 106 tonne of oil equivalent (toe), a unit of energy defined as the amount of energy released by burning 1,000 kilograms of crude oil. The IEA provides a unit converter online at http://www.iea.org/statistics/resources/unitconverter for other energy equivalents. For instance, 13,541 Mtoe equates to 5.6694 x 10²⁰ joules, the total world energy consumption. Efforts to determine how many batteries there are in the world are much more tenuous. The Freedonia Group, an international market research group, estimates the world production of batteries to be around $86.2 billion (http://www.freedoniagroup.com/ industry-study/2703/world-batteries.htm), but this number does not easily lend itself for use in a solution. Nor would figures that estimate the number of batteries thrown away each year in the United States (around 3 billion[12]) be especially helpful. A more satisfying approach might be to have students estimate the number of 9V batteries that would be required to provide 10 minutes of the world’s energy needs: A “conservative” estimate of the power capacity of a 9V alkaline battery (http://www.techlib.com/reference/batteries.html) is 500 mAh. Since power (in watt-hours) is current x volts, and 1 watt-hour is 3600 joules, a single 9V battery would contain 16,200 joules of energy: Dividing the world’s energy needs calculated above by the power capacity of a 9V battery indicates that 666 billion 9V batteries would be needed to supply the world’s energy needs. Using D batteries (13,000 mAh, 1.5V) would require about 1/4 as many batteries. Materials Procedure Discussion Topics brought up in this activity can lead in many directions. Students might be encouraged to question the assumptions made in order to perform the calculations (e.g., how accurate is the estimate of the energy needs of the entire world?). Or students might consider how this estimate correlates to energy usage per person on the planet; students could then attempt to estimate their own energy usage. Follow-up Have students consider the following statement: According to the Environmental Protection Agency (EPA), each year Americans throw away more than three billion batteries. That’s about 180,000 tons of batteries. More than 86,000 tons of these are single use alkaline batteries. Imagine, placed end to end these dead alkaline batteries alone would circle the world at least six times. About 14,000 tons of rechargeable batteries are thrown away in the United States. – http://everyday-green.com/html/battery_statistics.html Students will be asked what “facts” they would need to verify the assertions made. For instance: What is the circumference of Earth? How long is an alkaline battery? Additionally, students can consider the number of batteries thrown away, on average, by every person in the U.S. (about 10). Infographic Overview An infographic is a visual representation of information. It can illustrate a simple fact or condense vast amounts of knowledge into a form that is readily discernible. In other words, an infographic is “data sorted, arranged, and presented visually.”[13] Materials Procedure Discussion A selection of samples as well as a presentation on infographics can be found at http://www.cabarrus.k12.nc.us/Page/23236. Additional information on creating infographics can be found at http://mashable.com/2012/07/09/how-to-create-an-infographic/#9uYAeDpjs5qL, http://www.schrockguide.net/infographics-as-an-assessment.html. Follow-up The infographics that students create may be used on the culminating activity, A plan of action for sustainability Overview The Environmental Protection Agency defines sustainability as “the ability to maintain or improve standards of living without damaging or depleting natural resources for present and future generations.”[14] This activity will focus of the development of a plan to address the issue of battery disposal for stakeholders in public schools. This activity can also be integrated within the larger scope of sustainability as it relates to the school’s recycling efforts. According to a survey conducted by Ipsos Public Affairs, “Nine in ten adults (87%) report that they recycle, though only half of adults (51%) recycle every day.”[15] The School District of Philadelphia recently announced the launch of “GreenFutures,” the District’s first ever Sustainability Plan.[16] District-wide recycling will be implemented during the next school year but will only entail collecting the more commonly recycled materials (https://www.youtube.com/watch?v=XAjXosyHNGM) in the standard blue bins. There are no plans at this time to deal with non-standard (but recyclable) materials such as batteries, although the Office of Information Technology’s Educational Technology Group does have a program to handle other technology waste disposal.[17] Materials Procedure Discussion A number of retailers, such as Lowes, Home Depot, Staples, and Best Buy, participate in the Rechargeable Battery Recycling Corporation’s (RBRC) recycling program. Drop-off sites can be located at www.call2recycle.org/locator/, however these retailers generally do not accept single-use batteries. Several companies offer fee-based services for shipping used batteries and electronics. These include Battery Solutions (www.batterysolutions.com) and the Big Green Box (biggreenbox.com). Prices are based on weight, and costs typically run $100 or more for up to 50 pounds. The Philadelphia Streets Department (www.philadelphiastreets.com), which is responsible for the collection and disposal of residential trash and recyclables (as well as the construction, cleanliness and maintenance of the city’s streets), accepts household batteries at its Household Hazardous Waste events held at least once a year at various locations (http://www.philadelphiastreets.com/events/household-hazardous-waste-events). Eforce Compliance (www.eforcerecycling.com), a commercial recycler in Philadelphia, also holds collection events for electronic waste, including batteries. [1] One landfill facility in the Philadelphia area that encourages tours is run by J.P. Mascaro & Sons < http://www.jpmascaro.com/green-initiatives/community-tours.aspx>. [2] Waste Management, Inc. recently opened a state-of-the-art material recovery facility in northeast Philadelphia to process single-stream recycling for the region. [3] Slade, G. (2007, March/April). iWaste. Mother Jones. [4] Electronics TakeBack Coalition. (2015). E-Waste In Landfills: More E-Waste is Trashed Than Recycled, But Recycling Is Growing < http://www.electronicstakeback.com/ designed-for-the-dump/e-waste-in-landfills/>. [5] Voakes, G. (2012, October 12). The Lesser-Known Facts About E-Waste Recycling. Business Insider < http://www.businessinsider.com/the-lesser-known-facts-about-e-waste-recycling-2012-10>. [6] https://www.facebook.com/SimsRecyclingSolutions [7] https://www.dosomething.org/us/facts/11-facts-about-e-waste [8] http://www.library.illinois.edu/ugl/howdoi/webeval.html [9] Inexpensive but serviceable multimeters are available from Harbor Freight for $5.99 (and sometimes even less). [10] Harte explains the origin of the book’s title in the Preface (p. xiii). Later, he asks the reader to “provide [an] order-of-magnitude answer” to the question, “How many pairs of shoes can be made from a cow?” He offers a hint, “consider a spherical cow – and a spherical shoe, to boot” (p. 4). [11] According to the graph provided, this amount was approximately 12,500 Mtoe in 2011. [12] http://everyday-green.com/html/battery_statistics.html [13] http://www.hotbutterstudio.com/#/alps/ [14] http://cfpub.epa.gov/roe/chapter/sustain/index.cfm [15] http://www.ipsos-na.com/news-polls/pressrelease.aspx?id=5285 [16] http://webgui.phila.k12.pa.us/offices/e/environmental [17] http://webgui.phila.k12.pa.us/offices/e/environmental/programs–services/hazardous-material
More advanced batteries can be derived from aluminum and air (e.g., http://www.instructables.com/ id/Aluminum-Can-Saltwater-and-Charcoal-Battery/ or http://www.exploratorium.edu/files/teacher_institute/ downloads/Al-air.pdf), zinc and carbon (https://melscience.com/en/experiments/ zinc-carbon-battery/), and even mud (http://www.instructables.com/id/An-Easy-Cheap-Soil-based-Microbial-Fuel-Cell/). There are also kits readily available from MelScience.com, IASCO-TESCO.com, Mudwatt.com, and other companies.
Fact checking
10 minutes of the world’s energy needs could be converted as follows:
(g., how many seconds are there in a year?).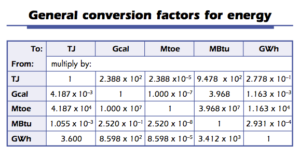
In this activity, students will examine several infographics critically and then create their own infographic using an online tool such as found at Infogr.am, Venngage.com, or Piktochart.com.
A plan of action for sustainability.
A promotional video of the operation is available online (https://www.youtube.com/ watch?v=yl1auc_MluQ).
< http://www.motherjones.com/environment/2007/03/iwaste>.
Print and Web: Battery University < http://batteryuniversity.com> Buchmann, Isidor. (2011). Batteries in a Portable World: A Handbook on Rechargeable Batteries for Non-Engineers, 3rd Ed. For the busy professional who needs a crash course on batteries; the engineer who searches for a battery to kick-start a product; the student who seeks answers for an academic project; as well as the everyday battery user who wants to learn how to extend the life of a battery. Electronics TakeBack Colation. (2016, January 13). Facts and Figures on E-Waste and Recycling. <http://www.electronicstakeback.com/wp-content/uploads/Facts_and_Figures_on_EWaste_and_Recycling1.pdf>. A summary of available statistics that help is to quantify the problems of electronic waste and e-waste recycling efforts Everyday-Green. (2010). Battery Statistics. Batteries. So easy to throw out! Why you shouldn’t Greenpeace. (2009, February 24). Where does e-waste end up? The US Environmental Protection Agency (EPA) estimates that as much as three quarters of the computers sold in the US are stockpiled in garages and closets. When thrown away, they end up in landfills or incinerators or, more recently, are exported to Asia. International Energy Agency. (2015). 2015 Key World Energy Statistics. The IEA publishes an annual compilation of its most used statistics, the Key World Energy Statistics, which contains “timely, clearly presented data on the supply, transformation and consumption of all major energy sources for the main regions of the world”. Rathje, W. and Murphy, C. (1992). Rubbish: The Archeology of Garbage. New York: HarperCollins. Show what the study of garbage tells us about a population’s demographics and buying habits. Rechargeable Battery Recycling Corporation. Charge Up to Recycle!® Battery Lesson Plan. < http://www.panasonic.com/environmental/rbrc_lesson_plan.pdf>. A series of activities that demonstrate how batteries work, explore different types of batteries, explain the need to recycle, and provide helpful battery usage and handling tips. Teach Engineering. (2010). Hands-on Activity: Design, Build and Test Your Own Landfill. <https://www.teachengineering.org/view_activity.php?url= collection /cub_/activities/cub_enveng/cub_enveng_lesson05_activity2.xml>. Students design and build model landfills using materials similar to those used by engineers for full-scale landfills. United States Environmental Protection Agency. (2015, June). Advancing Sustainable Materials Management: 2013 Fact Sheet. <http://www.epa.gov/sites/production /files/2015-09/documents/ 2013_advncng_smm_fs.pdf>. U.S. Environmental Protection Agency (EPA) has collected and reported data on the generation and disposal of waste in the United States for more than Wiggins, G., and McTighe, J. (2005). Understanding by design, 2nd ed. Alexandria, VA: Association for Supervision & Curriculum Development. A good introduction to the concepts of curriculum by unit development and problem-based learning, this book includes a useful template.
Battery University™ is a free educational website that offers hands-on battery information to engineers, educators, media, students and battery users alike. The tutorials evaluate the advantages and limitations of battery chemistries, advise on best battery choice and suggest ways to extend battery life.
Richmond, BC: Cadex Electronics, Inc.
<http://everyday-green.com/html/batteries.html>
< http://www.greenpeace.org/international/en/campaigns/detox/electronics/ the-e-waste-problem/where-does-e-waste-end-up/>.
<http://www.iea.org/publications/freepublications/publication/KeyWorld_Statistics_2015.pdf >
30 years. These facts and figures are current through calendar year 2013.
PA Common Core Standards for Reading in Science and Technical Subjects, 11-12 CC.3.5.11-12.A CC.3.5.11-12.B CC.3.5.11-12.C CC.3.5.11-12.D CC.3.5.11-12.E CC.3.5.11-12.F CC.3.5.11-12.G CC.3.5.11-12.H C.3.5.11-12.I CC.3.5.11-12.J PA Common Core Standards for Writing in Science and Technical Subjects, 11-12 CC.3.6.11-12.A CC.3.6.11-12.B CC.3.6.11-12.C CC.3.6.11-12.D CC.3.6.11-12.E CC.3.6.11-12.F CC.3.6.11-12.G C.3.6.11-12.H CC.3.6.11-12.I PA Academic Standards for Science and Technology 3.2.C.A4 3.4.12.C3 3.4.12.E3. PA Academic Standards for Environment and Ecology 4.5.12.A. 4.5.12.C. 4.3.12.D. 4.5.12.E. Next Generation Science Standards HS-PS1-7 HS-ESS3-1. HS-ESS3-2.