
This unit, One Island Two People: Visualizing and Comparing the Development Stories of Haiti and Dominican Republic is intended for ninth through twelfth grade learners in world history humanities classroom, but it can be used in an English or Social Studies stand-alone class. This unit incorporates data visualization skills and creating infographics to compare and contrast the economic development and underdevelopment of Haiti and Dominican Republic. This unit integrates a Global Citizenship theme; explores the interconnectedness of historical continuity and change. Students will ultimately develop infographic design skills, critical thinking skills, data literacy and data visualization know-how, suitable for 21st century college and career readiness.
“In a way, underdevelopment is a paradox. Many parts of the world that are naturally rich are actually poor and parts that are not so well off in wealth of soil and sun-soil are enjoying the highest standards of living. When the capitalists from the developed parts of the world try to explain this paradox, they often make it sound as though there is something ‘God-given’ about the situation…” (Walter Rodney, How Europe Underdeveloped Africa, 1973) Teaching students about the underlying economic principles of imperialism can be a heavy lift. Educators need to develop instructional strategies and materials that can balance keeping students’ interests with the need to develop students’ skills. According to Bradley Fogo of the Stanford Teacher Education Program, working with struggling learners should not preclude using an array of thought provoking documents and activities, when teaching about imperialism. These materials, however, need careful structuring and scaffolds; moreover, you will need to excerpt documents strategically and, in some instances, modify them so that materials are accessible to the students in your classroom. (Bradley) I am a Founding Humanities teacher at the U School where I teach my students to read, write and make sense of the world. The Humanities department co-designs our students learning experiences, integrating English Language Art and History content and competencies. Accordingly our units are designed with a specific Lens: American History, African American History, or World History. The U School’s competency based learning incorporates, non-traditional grading, mastery-based learning approach into our curriculum design. The school also provides the following elements in our design approach: personalized learning, design thinking principles, youth development and restorative practices. It’s an exciting place to teach and work, but it’s also super challenging and stressful for both students and teachers. The current pupil population is 340 (9th, -12th grade only). The student body is 80% African American, 13% Latinx , and 4% Caucasian. The balance of other students is bi-racially mixed or from other ethnic backgrounds. We have a sizable portion (28%) of students with disabilities and individualized learning plans. Many of the students come from working class families and over 95% of the student body qualifies for free or subsidized lunch. Most of all my students come from underfunded schools and trauma filled communities. However, despite this context most of my students are resilient and exhibit multiple talents and intelligences. (Gardner) When providing feedback on the African American History Curriculum at our school, one Latinx student noted that she felt the overall curriculum at school did not speak or connect to her. In designing the World History curriculum unit and this unit in particular, Connected Learning principles will shape the interdisciplinary learning and interest-driven inquiry activities, discussions, and projects that will allow multiple avenues for participation and engagement. (Ito et al.; Baker-Doyle) I shared an early draft of the student facing guide for this proposed unit with the same Latinx students, who is a senior and plans to attend college in the fall (2018). She was pleased with what she considered, a unit that would explore topics beyond the African American experience and happy that she played a role in a conversation that shaped a new curriculum for future students.
During the 2017-2018 academic year my students created infographics about African Empires and their forms of cultural expressions. Prior to creating infographics students completed a pre-assessment and topic immersion about basic geographical, cultural and economics features of African regions. In the pre-assessment survey 60.4% of my students identified that African resources were stolen without fair compensation. (See Google Sheets Graph below) Although most students could identify the concept of imperialism, our unit of study did not focus on the “why” of imperialism or dive into the data to explore the actual loss of human labor and natural resources and what economic impact imperialism had in enriching other nations and under developing others. This previous unit which was a part of African American history survey course, did not provide extensive content and knowledge that expanded students understanding of imperialism or data visualization. However, this intended unit, “One Island Two People”, will leverage data visualization skills and creating infographics to compare and contrast the economic development and underdevelopment of Haiti and Dominican Republic. This unit will form a cohesive part of Word History course that will incorporate a Global Citizenship theme; explore the interconnectedness of historical continuity and change, and explore what it means to be global a global citizen. To enhance students’ infographic design skills and critical thinking skills, data literacy and data visualization will be crucial for this unit’s success. According to the World Bank, Haiti and Dominican Republic had the same GDP (Gross Domestic Product) in the 1960’s. Some may wonder what accounts for the current vast economic disparities. Interestingly, Haiti used to be much richer and more powerful than it Island neighbor Dominican Republic. In fact in the 19th century Haiti launched several major invasions of the Dominican Republic and annexed it for 22 years. (Erenow) Both nations have had overbearing leaders, Rafael Trujillo (Dominican Republic 1930-1961) and Francois “Papa Doc” Duvalier and his son Jean-Claude “Baby Doc” Duvalier (Haiti 1957 to 1986). Furthermore, both countries have experienced European colonialism and American occupations. Paradoxically both countries have weathered similar disasters with vastly different results. So the question really begs why such differences? According to The Organisation for Economic Co-operation and Development (OECD) data sources, Haiti is heavily dependent on foreign aid. In 2016 Haiti’s Official Development Assistance (ODA) was over 4 time greater Dominican Republic’s ODA OECD). And as reported in the Guardian (United Kingdom) since the tragic 2010 catastrophic earthquake, Haiti has received an unprecedented amount of support of more than $9bn (£5.6bn) in public and private donations. The author of the Book “Dead Aid” and economist Dambisa Moyo argues that aid actually undermines the social and economic fabric of the developing countries. (Moyo) There are many factors that contribute to why Haiti and Dominican Republic have unstable or stable governments. Fundamentally, it appears that foreign aid in particular is not actually helping Haiti, and conversely less reliance on aid is working out better for Dominican Republic. This unit in part, will give students voice and choice to grapple with the vexing geographical, historical, cultural and racial issues that help tell the story of “One Island ;Two People”. Creating relevant, rigorous and connected curriculum does not happen overnight. At the U School the Humanities Department uses a backward design approach to develop curriculum units. Our unit design process emphasizes inquiry-driven, culturally-relevant learning which strives to promote student autonomy and self-expression. For this particular unit students will explore the similarities and differences of populations that are often hiding or overlooked in our curriculum. In particular, the voices and tensions of Haitians and Dominicans which are not often featured in our classrooms, will be the focus for this unit. This unit will incorporate a design process that guides students through iterative stages of production: discover, define, design, develop, and deliver (Figure 1). Some steps for incorporating this recursive design process for this unit include: “delivering” data rich infographics, providing scaffolding to reach our learning objectives. The “Discover” steps include activities that frame the unit’s overarching inquiry, immersing students in its central tensions and higher order thinking about Haiti and Dominican Republic’ social, political, economic and racial dynamics. While the “Define” steps include activities that introduce or reinforce concepts/ content and technical vocabulary needed to navigate and complete the formative performance tasks. The “Design” and “develop” steps involve drafting, prototyping, and soliciting feedback to refine the culminating production of data rich infographics comparing and contrasting Haiti and Dominican Republic. And lastly the “deliver” stage invites students to share their work — either with the class, or with public audiences. (Ito et al: Nichols). Figure 2 provides a list of the proposed student facing unit guide activities. The glue for this unit design is ensuring legible objectives and scaffolding strategies.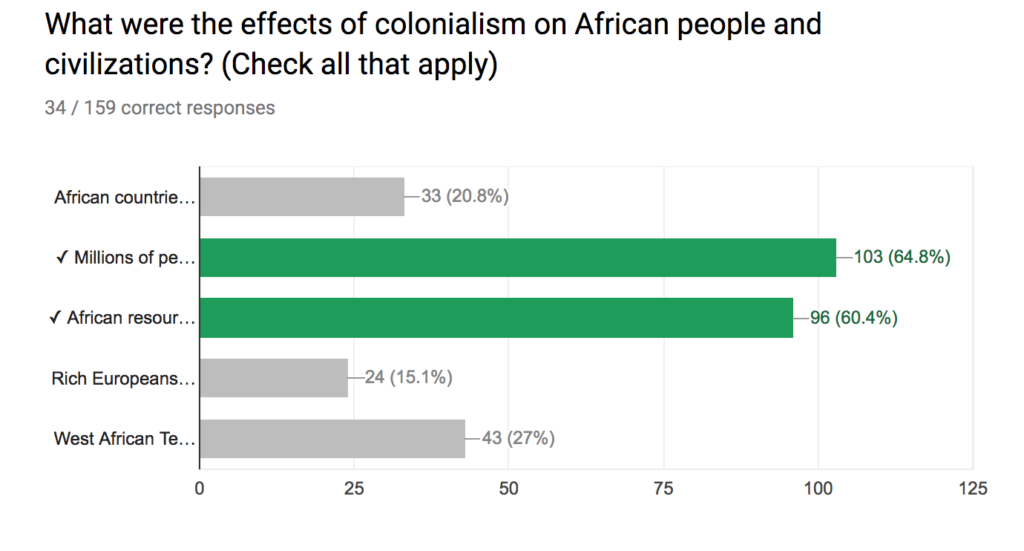
One Island: Economic Disparities & The Foreign Aid Curse
Student Voice, Connected Learning, Design Process
For this unit, students will read relevant materials articles and historical accounts that include comparative text (nonfiction and creative nonfiction), statistics and data about Haiti and Dominican Republic, the unit will tangentially explore the “development curse” — and, specifically, the role dictatorship, imperialism and development plays in representing and shaping individuals’ lived experiences. The unit will culminate in students composing a data rich infographic / chart comparing and contrasting the development / underdevelopment of Haiti and Dominican Republic. Students will use data visualization to inform and explain how geographic, social, political and economic conditions lead to important changes for two important Latin -Caribbean nations. This unit provides scaffolds for exploring data and comparing the economic impact dictatorship, imperialism and racism had on Haiti and Dominican Republic. The unit incorporates inquiry while still meeting competencies aligned to Common Core State Standards. (See expanded list of content standards in the Figure 3) However, the specific competencies and sub competencies for this unit are listed below: ● ELA 2.8 Evaluate arguments and claims. ● ELA 2.9 Acquire and use academic vocabulary.
● ELA.4 Writing Informational Text
● ELA 2.7 Compare and contrast different texts and media.
● HIS.1 Evaluate Change, Continuity, and Context
● HIS 1.2 Analyze outcomes as change, continuity or both.
● HIS.2 Analyze Perspective
● HIS 2.2 Analyze the perspectives of writers of history shape our perception of the past.
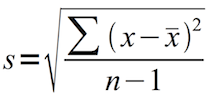
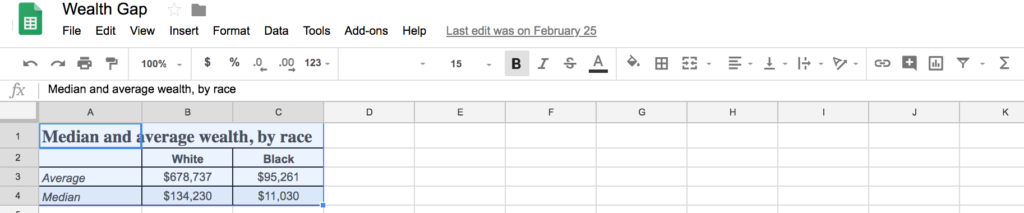
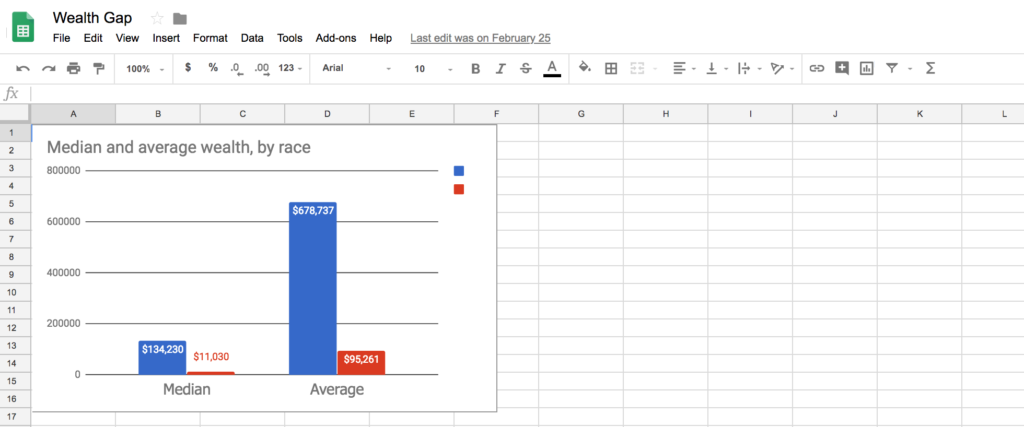
This unit will rely upon important data literacy and visualization skills. It is important to note that data-literacy is the ability to consume knowledge, produce coherently and think critically about data. Consequently, data literacy includes statistical literacy and understanding how to work with data sets, how they were produced, how to connect various data sets and how to interpret them. (Kayser-Bril) For a visual representation of these components refer to the Data Literacy venn diagram in the figure 4. The associated strategies to improve students’ data literacy skills are provided below. Information literacy supports students in “recognizing when information is needed and how to locate, evaluate, and effectively use information. Information literacy also is increasingly important in the contemporary environment of rapid technological change and proliferating information resources. (Wesleyan University). For this unit, students will be able to explore, create and share demographic and economic data from various sources such as the World Bank Data sets. Statistical literacy is the ability to read and interpret summary statistics in the everyday media: in graphs, tables, statements, surveys and studies. Statistical literacy is not only relevant in math classroom but also in humanities courses. This is particularly important because only about 40% of all US college students graduating in 2003 had non-quantitative majors.” (Statlit.org) For this unit, students will keep a data journal and use basic statistical concepts such as central tendency and trends in order to closely read and analyze charts, graphs and other data sets. The ability to use the design process to create visually appealing and easy to follow graphics and text is an important college and career technical skills. Designing infographics will be focus for this unit. Accordingly, students will create infographics, charts and images that convey important and complex data. It will be important for students to consider page layout, format, and typography. Students will have to consider where to place graphics on a page and where or how to set tables/ charts, as well as how to organize and arrange raw data sets which allow readers to easily compare facts and figures. For depicting changes over time students will need to make line graphs; while for comparing different variables students will want to create bar graphs ; for comparing parts of a whole students could create pie charts. Lastly to show data about different regions students could create maps or incorporate coloring, shading and other design choices. The unit will rely upon online journals, articles, creative non-fiction text, World Bank data sets, videos, infographics and visual texts. Consequently students will need to be able to closely read, write and make sense of text which includes statistics and data about economic, social, political conditions and trends related to Haiti and Dominican Republic. The following strategies will be useful when implementing this unit. SQR3 (Survey, Question, Read, Recite.and Review) is a comprehension strategy that helps students think about the text they are closely reading. Often categorized as a study strategy, SQ3R helps students “get it” the first time they read a text by teaching students how to read and think like an effective reader. (Adlist.org ) This strategy includes 5 steps: It important for student with or without knowledge of math or statistics to finds ways to track and document how they are making sense of data, graphics and charts. This can be done by having students take notes with 3 key questions in mind. (Kayser-Brill) Google Trends offer a deeper dive into the powerful world of data and visual digital tools. Teachers and students could explore ways to analyze, interpret and visualize data in interesting ways. Other useful Google Data Journalism tools include: Google Public Data Explorer, Google Consumer Surveys, Google Fusion Tables, and Google Crisis Map. (Google Trends) When reviewing and collecting raw data and charts from the World Bank Indicators, students should be able take demographic, and socio-economic measurements to summarize them in some way, because raw numbers are not easily understood. There are key types of statistics to consider when summarizing a set of numbers: (Data Analytics) Standard deviation is used when the data are normally distributed. . The general formula for calculating standard deviation looks like the following: (Calculating standard deviation) Spreadsheets are an effective tool for graphing data. Google Sheets will allow students to enter data from sources such as the World Bank or International Monetary Fund. The following quick steps and visuals demonstrate how to convert data into a graph or chart. The forthcoming sample lesson plans will provide further examples and context for using Google Spreadsheets. Designing and presenting infographics are very effective alternative to the typical five paragraph essay assigned in many high school classrooms. An infographic is a representation of information in a graphic/visual format designed to make the data easily understandable at a glance. The anchor performance task for this unit is creating an infographic. The goal will be for students to create a design that is attractive, easy to read and reflects on students’ inquiry on the development and underdevelopment of Haiti and Dominican Republic. To achieve a compelling infographic design the following tips should be considered. Sample Guide for Designing and Creating Infographics Publish and Share -Classroom exhibitions allow students to present and share infographics explaining both the content and design process. Inviting students to share their infographics with wider audience will increase the success and engagement of this unit. YouthVoices.Net is a school-based social network where U School students have shared infographics, poems, articles, and other fiction and non-fiction media. Assessments will include evaluation of students’ infographics using, for example the ELA 4.1 competency. (How Well Do I introduce my topic) I can write a compelling hook to captivate my audience and I can preview the organizational structure of my text (compare/contrast, cause/effect, claims and supports, etc.) I can write a compelling hook that captivates my audience, previews the organizational structure, and provides context. I can write a compelling hook that is most appropriate for my audience. I can preview the organizational structure, and provide context and outline key issues related to the topic. In this case the assessment is focusing on the heading of infographic title and subtitle and the common core aligned continua can be used to assess students’ grade level ability to address the following questions:. Similarly other elements of students’ infographics (captions, charts, images, data sources) will be evaluated using the ELA 4.4 competency (How well do I use precise language, vocabulary, and techniques? (ELA 4.4) I can choose quotations and introduce them with phrases like “the author said,” or “according to the text.” I can add an in-text citation at the end of the sentence, in parenthesis, and before the period. I can ensure that all my information is from trusted and significant sources. I can choose quotations, integrate them into my own sentences, and provide information about the quotation’s location in the text or source (“after Susan hits Bill”; “according to the narrator”). I can add an in-text citation at the end of the sentence, and I can use ellipses to shorten or remove unnecessary parts of quotations. I can fully develop and define my categories and/or support my argument. I can ensure that I use multiple trusted and significant sources. I can choose quotations and integrate them into my own sentences, providing context for the reader to understand the quotation. I can add an in-text citation at the end of the sentence, and I can use ellipses to shorten quotations, and brackets to make changes in person and tense, and to clarify unclear pronouns. I can fully develop and define my categories and/or support my argument as well as evaluate other points of view and/or conflicting information. I can ensure that I use multiple trusted and significant sources. I can choose quotations and integrate them into my own sentences, sometimes using strings of related quotes in the same sentence, and always providing details and context for the reader. I can add an in-text citation at the end of the sentence, in parenthesis, and before the period, and I can use ellipses and brackets to modify quotations. Ultimately through legible objectives, strategies and lesson activities, students will uncover how to visually represent the similarities and differences between the development and underdevelopment of one island inhabited by two distinct group of people (Haiti and Dominican Republic).Information Literacy
Statistical Literacy
Technical Visualization
Reading and Writing Strategies
Close Reading (SQR3 System)
Data Journaling, Note Taking & Google Trends
Summarizing Data
Google Spreadsheets and Graphing Data
Designing and Presenting Infographics
Assessment
Level 6
Level 8
Level 10
Level 12
How well do I introduce my topic? (ELA 4.1)
I can state the topic I will be informing my reader about.
I can state the topic I will be informing my reader about and preview the subtopics in the order they will be introduced.
I can state the significance of my topic.
I can fully explain the significance of my topic by asking essential questions and/or referencing universal themes.
Level 6
Level 8
Level 10
Level 12
How well do I use precise language, vocabulary, and techniques? (ELA 4.4)
I can provide specific facts and information about my topic in my own words, using charts, graphs, images, etc., when appropriate.
I can provide specific information about my topic to fully define my categories and/or support my argument, while integrating charts, graphs, images, etc., purposefully.
I can provide significant information about my topic to engage my audience, while integrating charts, graphs, images, headings, etc. effectively.
I can provide the most significant information about my topic that is relevant to my audience, while integrating charts, graphs, images, headings, etc. effectively.
Title: KWLQ – How Haiti and DR became two worlds? Grade Range and Subjects: English / World History 9-12th Grade Large Group (20 – 33 students) Duration of Lesson: 45- 60 Minutes Goal(s): Students will complete a KWLQ chart and reflect on some of the factors that have shaped how and why Haiti and Dominican share one island but became two different people. Mini Lesson: Students will complete the KWLQ Chart before, during and after viewing an aerial forestation map of the Island of Hispaniola and listening to the NPR podcast : Island Of Hispaniola Has Two Varied Economies https://www.npr.org/templates/story/story.php?storyId=123635356 Each column should have at least four details written. Activities: Students will dig a little deeper and explore the role imperialism played in creating two different worlds and reflect how on geography, economics and cultural difference contributed to the development or underdevelopment of two countries sharing the same island. Teachers should be prepared to support students in discussing the ways racism impacts the relationship between Haitians and Dominicans? Students should share their responses and be prepared to describe similar racial and/or ethnic tensions in other parts of the world (Not Only in USA)? Title: Dictators and Imperialism Curse: Continuity and Change Grade Range and Subjects: English / World History 9-12th Grade Large Group (20 – 33 students) Duration of Mini Lesson: 60- 120 Minutes Goal(s): Students will read historical accounts about Dominican Republic and Haiti dictators, Rafael Trujillo, François “Papa Doc” and Jean-Claude “Baby Doc” Duvalier, respectively, and analyze the ways in which people, events, and ideas represent continuity or change. Mini Lesson: Students will use the SQR3 reading strategy to preview The Economist article, “Hispaniola- The Dominican Republic and Haiti: one island, two nations, lots of trouble” Students will scan and review the headings, bolded text, and charts and generate some open and closed questions about what things have changed and what things have stayed the same in both nations. Activities: Students will closely read , and use evidence from, The Economist article, and the biographies of Rafael Trujillo , François Duvalier, “Papa Doc “ and Jean-Claude Duvalier, “Baby Doc” to answer the following question: How did the dictatorships in both Dominican Republic and Haiti illustrate continuity or change? Student’s response should be 3-4 paragraphs. In each paragraph, students should include specific quotes as evidence from the text provide. 1 paragraph with examples of how the socio economic condition of both Dominican Republic and Haiti have stayed the same (continuity) 1 paragraph with examples of the socio economic condition of both Dominican Republic and Haiti has changed. 1-2 paragraphs explaining why this change and/or continuity matters today. The History Competency 1.2 How well can I make sense of the outcome as either change, continuity, or both? Will be used to assess this Higher Order Thinking Task. For a scaffold students may want to use the graphic organizer provide below. History 1.2 Continuity and Change Continua In my explanation, I can use details about the developments and event(s) to support my answer. I can explain my reasoning using specific details about the developments, event(s), and the context surrounding the event(s). I can explain my reasoning using specific details about the developments, event(s), and the context surrounding the event. I can use secondary interpretations to support my explanation. I can cite my source properly. I can explain my reasoning using specific details about the developments, event(s), and the context surrounding the event. I can use secondary interpretations to support my explanation. I can compare the outcome of the major event(s) to another historical event from a different time period, using evidence to analyze and explain the patterns of continuity and/or change them. I can cite my sources properly.Graphic Organizer Sample Lesson Plan 1
K: What do you already know about the Haiti and Dominican Republic?
W: What do you want to learn about the land and economies of Haiti and Dominican Republic?
L: After viewing the map and listening to the podcast, describe why two countries sharing the same Island have different economies?
Q: What questions do you still have about the differences and similarities of Haiti and Dominican Republic?
Sample Lesson Plan 2
How well an I make sense of the outcome as either change, continuity, or both? (HIS 1.2)
I can explain whether the outcome of the major event should be described as a change or as a continuation of the same thing that was happening before.
I can classify the major event(s) as an example of either change and/or continuity in history.
I can identify and explain how the outcome(s) of the major event(s) is an example of either change, continuity, or both.
can identify and explain how the outcome(s) of the major event(s) is an example of either change, continuity, or both.
Continuity
Change
Continuity is the idea that institutions, ideas, and problems remain the same over time.
Change is the constant changing of society by the forces of history.
Dictators and Imperialism in Dominican Republic and Haiti : Continuity and Change
Paragraph 1 – Continuity: In what ways has the conditions of Dominican Republic and Haiti remained the same throughout history?
Paragraph 2 – Change: In what ways the condition of Dominican Republic and Haiti changed throughout history?
Evidence from Text
Your explanation (YOUR OWN WORDS)
Evidence from Text
Your Explanation (YOUR OWN WORDS)
According to _______________ (name of source), “__________” (your selected quote here)
This shows a continuity because
According to ______________ (name of source), “_________” (your selected quote here)
This shows a change
According to _______________ (name of source), “__________” (your selected quote here)
This shows a continuity because
According to ______________ (name of source), “_________” (your selected quote here)
This shows a change
According to _______________ (name of source), “__________” (your selected quote here)
This shows a continuity because
According to ______________ (name of source), “_________” (your selected quote here)
This shows a change
Paragraph 3 – Based on what I have read about Dominican Republic and Haitian Dictators and Imperialism, I would argue that the conditions of overtime highlights continuity or change (bold your selection) because…
[For additional lesson plans please see PDF attached above]
Americas -Jean-Claude Duvalier Dies at 63; Ruled Haiti in Father’s Brutal Fashion. New York Times, www.nytimes.com/2014/10/05/world/americas/jean-claude-duvalier-haitis-baby-doc-dies-at-63.html. Accessed 15 June 2018. This New York Time article provides a feature story of the life and times of Jean-Claude “Baby Doc” including a stunning visual timeline. Data Analytics. www.dataanalytics.org.uk/index.htm. Accessed 14 June 2018. This open source site provides basic tips on how to use statistic to summarize data. These tips will be useful for data journalizing and note taking strategies. Data Literacy HB. datajournalismhandbook.org/1.0/en/understanding_data_0.html. Accessed 9 June 2018. This blog post provides tips for data journaling Data Literacy Venn Diagram. www.flickr.com/photos/notbrucelee/7161142384/in/photostream/. Accessed 9 June 2018. This visual diagrams depicts the key components of Data Literacy. Fogo, Bradley. Teaching Imperialism: Incorporating Learning Activities and State Standards. Stanford Teacher Education Program, teachinghistory.org/teaching-materials/ask-a-master-teacher/24534. Accessed 18 June 2018. Fogo contributes to “Teaching History.Org, the home of the National History Education Clearinghouse.. This article provides useful tips for teaching about imperialism. Gardner, Howard. Multiple Intelligence. www.tecweb.org/styles/gardner.html. Accessed 18 June 2018. The theory of multiple intelligences was developed in 1983 by Gardner, He proposes eight different intelligences to account for a broader range of human potential in children and adults. “Information Literacy.” Wesleyan University, www.wesleyan.edu/libr/infoforyou/infolitdefined.html. Accessed 11 June 2018. Wesleyan University Library provides background standards on information literacy. Diamond Jared. One Island Two People. http://home.sandiego.edu/~kaufmann/hnrs379/Diamond_2005_Collapse_Ch11.pdf Accessed 15 June 2018. The chapter from this selection comes from the book “Collapse How Societies Choose to Fail or Succeed. It provides a comprehensive view of the differences. histories., environmental impacts and future of Haiti and DR. “NRGI Reader March 2015.” National Resource Governance Institute, Mar. 2015, resourcegovernance.org/sites/default/files/nrgi_Resource-Curse.pdf. Accessed 19 June 2018. The Natural Resource Governance Institute produced an analysis of the cause and effect of the resource curse. The report includes very effective infographics about the development and under development process . Nichols, T. Philip, et al. “English Journal Work-In-Progress.” Biography As Curriculum . This article is under review and is not published yet. U School Humanities educators co wrote this article about our curriculum design process. Francois” Popa Doc: Duvalier. Notable Biography. NotableBiographies.Com, www.notablebiographies.com/Du-Fi/Duvalier-Fran-ois.html. Accessed 15 June 2018. This brief biography provides the story of the life and times of Francois” Popa Doc: Duvalier. Patrick, Stewart M. Why Natural Resources Are a Curse on Developing Countries and How to Fix It. Atlantic Magazine, 30 Apr. 2012, www.theatlantic.com/international/archive/2012/04/why-natural-resources-are-a-curse-on-developing-countries-and-how-to-fix-it/256508/. Accessed 19 June 2018. This Atlantic article provides insights on how developing countries can respond to the resources curse. Rafael Trujillo History.Com. History.Com, www.history.com/topics/rafael-trujillo. Accessed 15 June 2018. This brief biography provides the story of the life and times of Rafael Trujillo. Disaster Divided. CNN, www.cnn.com/2016/10/11/americas/haiti-dominican-republic-visual-explainer/index.html. Accessed 15 June 2018. This CNN article includes text and visuals to highlight the history, geography , economy and disasters that have impacted Haiti and DR. Educators and students can use this resource for background and seed ideas for infographic topics. Divided Island: How Haiti and the DR Became Two Worlds. VOX, www.youtube.com/watch?v=4WvKeYuwifc. Accessed 19 June 2018. This Vox Video can be viewed by students and educators to gain insights on the development and underdevelopment tensions between Haiti and DR. This video will especially useful for auditory and visual learners. Dollar Street. https://www.gapminder.org/dollar-street/matrix?thing=Plates%20of%20food&lowIncome=26&highIncome=15000 Accessed 19 June 2018. Dollar Street was invented by Anna Rosling Rönnlund at Gapminder. to make global public data easier to understand and use. Student can use this site to compare cost of goods and commodities across wide range of regions and income groups. How To Create Graphs in Google Sheets. Wiki How, www.wikihow.com/Create-a-Graph-in-Google-Sheets. Accessed 15 June 2018. Educators and Students can use these how-to-instructions to help with creating graphs using Google Sheets. Joffe-Walt, Chana, and Adam Davison. Island Of Hispaniola Has Two Varied Economies. NPR, www.npr.org/templates/story/story.php?storyId=123635356. Accessed 19 June 2018. Educators and Students can listen to this This Planet Money series that discusses how two countries have very different economies, through sharing the stories of two men who make T-shirts for a living — one in Haiti, the other in DR. Joffe-Walt, Chana, Planet Money: Made In Haiti. NPR, www.npr.org/sections/money/2010/02/made_in_haiti.html. Accessed 19 June 2018. Educators and Students can read this NPR article for seed ideas for infographic topics about Haiti and DR. Noah, Trevor. Donald Trump – America’s African President: The Daily Show. Comedy Central, www.youtube.com/watch?v=2FPrJxTvgdQ&feature=youtu.be. Accessed 19 June 2018. This satire by the Daily Show’s, comedian Trevor Noah, compares Donald Trump to African Dictators. Students and educators can view this light hearted piece to gain some insights into the made up dictators studied in this unit. World Bank Open Data Source. data.worldbank.org/. Accessed 19 June 2018. Educators and students can use this site to download development indicators, compiled from officially-recognized international sources.Educator Resources & References
Media & Student Resources