
This unit is based on the Teacher Institute of Philadelphia’s seminar entitled, “Data Visualization.” The seminar discussed methods of data analysis, types of data displays, and how to improve data displays to best demonstrate the thesis of the data. The unit focuses on teaching statistics through culturally and locally relevant topics. Using social justice to teach mathematics and reinforcing that math is a tool for change. The question to ask is how might we as teachers of mathematics, make a difference in the teaching and learning of mathematics that promote integrated, authentic, and relevant mathematical experiences for all students?
Students will be learning how to: organize data using frequency tables, stem and leaf plots, and x-y charts; display data using histograms, box and whisker plots, and scatter plots; and analyze data using measures of central tendency, linear regression, and measures of variance. Students will also learn to justify their choice of data display, to create data displays to demonstrate the inequities of society, and how we can use math to initiate change. The culminating task is a public service announcement proposing the change the students have come up with based on the data analysis they have conducted.
How many times has a teacher in a secondary math classroom been asked the question, “when am I ever going to use this?” I chose to write this unit to provide ninth grade math students with an answer. Math is a tool; and a tool that can be used for change. Math can be a means to give you a voice and make your point heard I teach Algebra 1 to 9th graders at an urban high school in the East Mount Airy neighborhood of Philadelphia. Hill Freedman World Academy (HFWA) serves approximately 700 students in grades 6 -12. 73% of our students receive free or reduced price lunch. 86% of the students are African American, 4% Latinx, 4% Asian, 2% White, and 5% other. 22% of the students at HFWA are special education students. Mathematics is a subject of visualization, which is an idea that is often lost in the typical high school classroom. Students are often unable to see the connections that exist both within and between mathematics and their lives as Philadelphia teenagers. Students are accustomed to approaching math in a structured and rigid manner, so the beauty and connected experience of mathematics is lost in the classroom. How do we get students to see the relevance of math and how it is connected to their world? The 9th grade students that I teach at Hill Freedman World Academy are quite talkative with many opinions. My goal with this curriculum unit is to take their love for voicing their opinions and thoughts and turn it into a math project. This project harnesses a student’s interest in a topic to generate engagement with mathematical concepts. The first step is to have the students choose a social action topic or question for which they have strong feelings. Social justice is the process of fair relations between an individual person and the larger society. The social action topics that the students will be exploring are areas where social injustice exists within their local community or the larger society. The students will then collect a set of data pertaining to their topic through research. The students will apply the skills they have learned in algebra to analyze the data and use data visualization to present the narrative of their thesis. With the presentation of their data, the students need to propose a change to right the social injustice that exists. The student’s proposal for change will be presented through the creation of a public service announcement with their call to action. The question “How can I use data visualization to help others better understand the social injustice that is present within my topic” will motivate both the analysis and the student. I want my students to understand how math can be a tool for change and I want my students creating proposals for change using sound mathematical solutions. Too often math is just used to show inequities in society. The goal of this unit is for the students to analyze data, understand an issue, and propose a solution. Things do not change if we only list the issue. There needs to be proposed improvement. Students always ask the questions, “When am I going to need this, When am I going to use this, or Why do I need to learn this?” This unit will show students the importance of mathematics as a tool for change and demonstrate how it is connected to their lives. This unit fits into the Algebra 1 curriculum and the common core standards under the unit of Statistics and the categories: Interpreting Categorical & Quantitative Data, Making Inferences & Justifying Conclusions, and Summarize, Represent, and Interpret Data on Two Categorical and Quantitative Variables. The focus will be on the student’s ability to summarize, interpret, and represent data. Present in this unit are also a majority of the Standards for Mathematical Practice. The Standards for Mathematical Practice exemplify the habits and behaviors of mathematicians. To summarize, why should people teach this unit? Students need to be reading, writing, thinking, speaking, and visualizing in secondary mathematics classrooms.
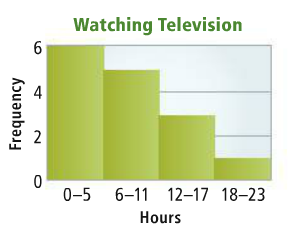
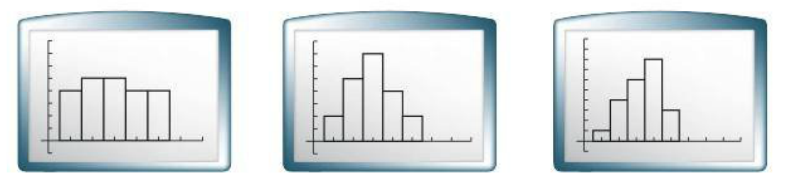
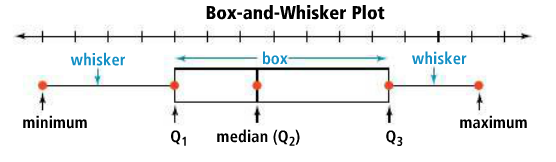
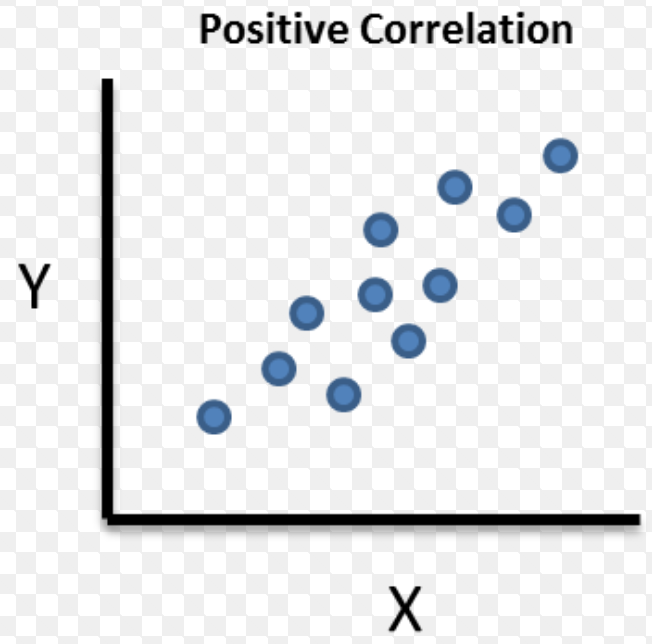
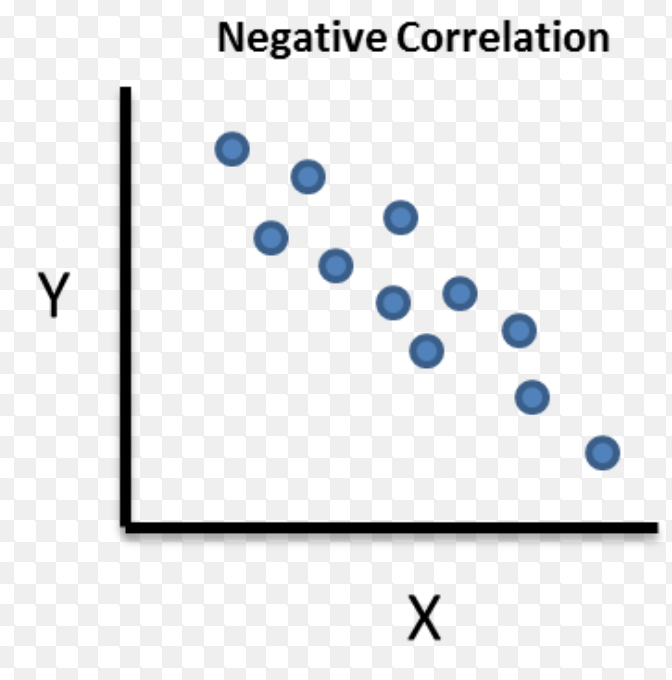
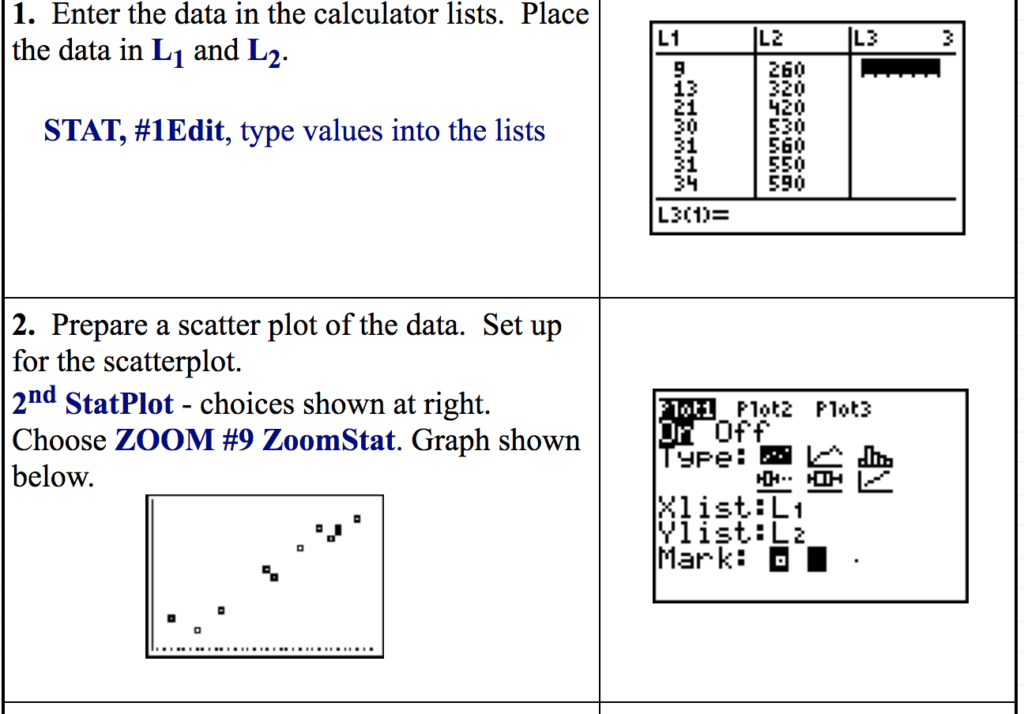
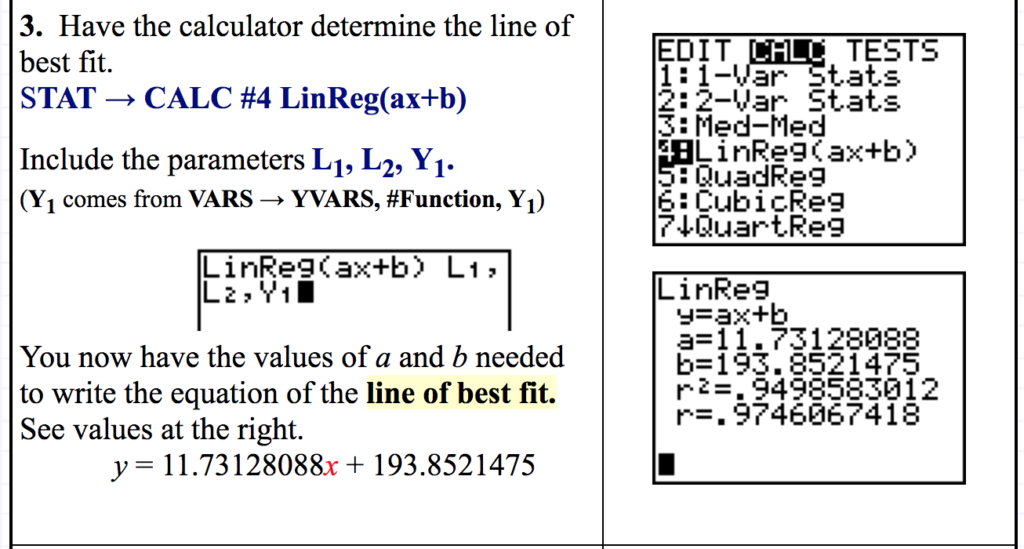
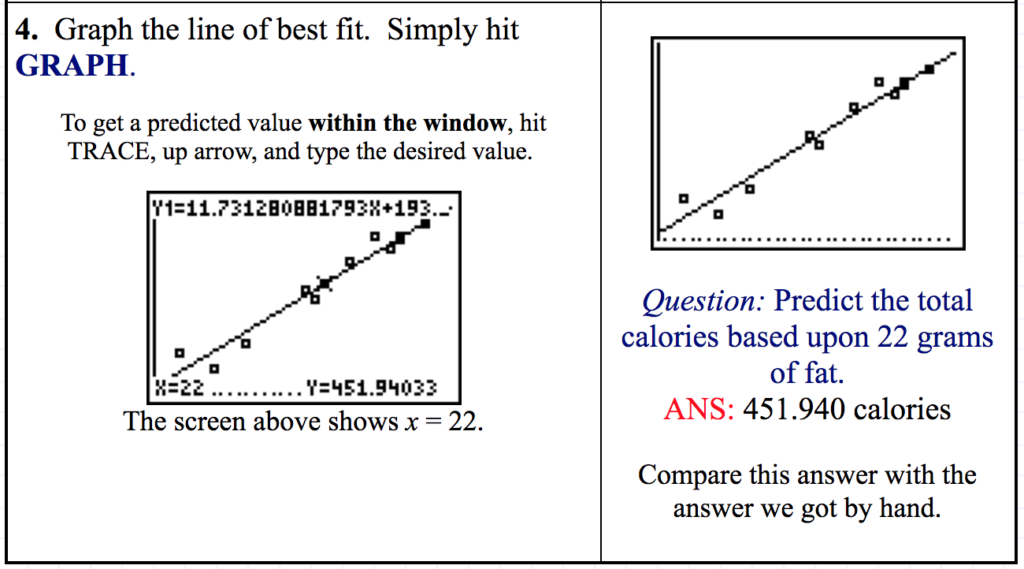
The motivation for this unit is teaching mathematics using social justice. Math instruction should help the students develop a growth mindset. All students are capable of learning. No teacher, educator, or adult would contest that every young person has the ability to learn. Except this is not always the mindset present when we consider math education. Students are often told they are not a “math person” or that their brain is just not wired for math. Every single individual is capable of learning math, we just need to provide them with opportunities for learning. We need to provide instruction that allows them to see connections to the world that they live in. Math needs to be taught as a growth subject with room for students to struggle and learn. We need to show that math is an open and creative subject. This approach to mathematics instruction is different than what is seen in a traditional classroom. Society has evolved, as have instructional methods in many disciplines. But for some reason, math education has not changed or evolved. “As we increasingly move toward an environment of instant and infinite information, it becomes less important for students to know, memorize, or recall information, and more important for them to be able to find, sort, analyze, share, discuss, critique, and create information.” (Wesch, 2009) Wesch goes on to say “we need to stop focusing on whether students are knowledgeable and help them become ‘knowledge-able’.” In the typical math classroom learning is very passive. Math instruction is focused around arbitrary rules and procedures as opposed to the connected and creative subject that it actually is. Math class needs to provide learning opportunities for the students that requires them to ask questions and find answers to questions that have meaning to them. “Moving students from knowledgeable to knowledge-able means presenting them with authentic learning opportunities from which they can both find answers and generate more questions. We should be inspiring in our students’ curiosity about the world, not about how many points they need to get an A.” (Brock & Hundley, 2016) Effective math instruction utilizes student interest and allows the students to make personal connections and see themselves or their lives in what they are learning. Math instruction should utilize the content that is relevant to the lives of the students that you teach. As math teachers we want students to care more about what and why they are learning as opposed to being only focused on the grade that they will earn for the assignment. We can create relevant content by making connections to social justice issues. Learning in the classroom can start with a discussion of the issues that are present in their communities, their school, and their families. From this discussion comes a collection of topics in which data can be collected. With the data, the students can begin to calculate and analyze. They can make conclusions and justifications. They can learn to use math to defend their ideas. With their conclusions can be proposals for change, reinforcing that math is a tool for change. The following sections below outline the research behind teaching mathematics using social justice, teaching using problem/project based learning, the mathematics content present in the unit and how data visualization can enhance the content. The subject of ethnomathematics describes the need to teach mathematics in a connected and relevant manner. As much as possible the content needs to be relatable to your students and the students need to be able to see themselves in what they are learning. Teaching mathematics from an equity standpoint describes the research defending math’s role as a tool for change and empowers the students to engage in change. Problem/Project Based Learning The goal of problem-based learning is to “provide students with authentic, real-world problems on which they must use deep thinking and collaborative skills to solve.” (Brock & Hundley, 2016) These problem-based tasks “give students a real opportunity to come up with solutions to issues that affect them.”(Brock & Hundley, 2016) By students choosing a social justice issue that matters to them or that is affecting the community that they live in the students are being given a problem to solve that impacts their own lives. The problem is authentic to the student. The students not only see why they need math, or the value that math can provide, but they can see why the solution is important and why they are solving the problem. Coming up with a proposed solution to a social justice topic is a challenging and open ended problem that allows the students to have a voice and to choose an issue that they care about. There are eight main features of project based learning (Buck Institute of Education (BIE) Ethnomathematics By definition ethnomathematics is defined by Brazilian mathematician Ubiratan D’Ambrosio as “intersections of culture, historical traditions, sociocultural roots, and mathematics. It seeks to answer the perennial question of students in mathematics classes everywhere: What’s the relevance?” How many times as a teacher have your math students asked the question of ‘when am I ever going to use this?’ Or ‘why do I need to learn this?’ Students are unable to see themselves in the math that they are learning. Their daily lives feels disconnected from the classroom. “Much of today’s curriculum is so disconnected from the child’s reality that it is impossible for the child to be a full participant in it. The mathematics in many classrooms has practically nothing to do with the world that the children are experiencing. Just as literacy has come to mean much more than reading and writing, mathematics must also be thought of as more than, and indeed different from, counting, calculating, sorting, or comparing.”(D’Ambrosio, 2001) As math teachers, it is our job to create those connections. Student need to see how math is used in the real world. They need to see it as more than counting apples and oranges. They need to see it as a tool for advancement and survival. The students need to see the value in the math that they are learning and how it relates to and impacts their lives. “The goal of mathematics education should be to foster students’ ability to successfully use modern technology to solve problems and communicate their thinking and answers as they gain an awareness of the capabilities and limitations of technological instruments. We can help students realize their full mathematical potential by acknowledging the importance of culture to the identity of the child and how culture affects how children think and learn.”(D’Ambrosio, 2001) A student is more likely to be an active participant in their learning if we are able to provide them with assignments that require them to solve real problems and problems that they have had a voice in and that they deem to be important. When a student can see their culture or their identity in what they are learning or they can recognize the problem that they are working to solve is one that is present in their own community they see the ‘why’ of learning. The students are able to answer the question, ‘why are they learning this’ and ‘why does this matter’. This unit’s focus on social justice is because of the concepts covered in ethnomathematics. Teaching for social justice also includes helping students develop positive social and cultural identities by validating their language and culture and helping them uncover and understand their history (Murrell, 1997). Learning about social justice in the math classroom uncovers many inequities that exist in the lives of the students. The importance here is demonstrating the power of math and using it to make a change and how change can happen. Teaching about social justice is more than just uncovering the inequity, it is problem solving and inquiring how to make things better. Math for Equity While ethnomathematics addresses the importance of a student seeing themselves in what they are learning and being able to make a personal connection to the content and the learning process, another method of creating a strong math classroom is teaching math for equity. Math is a tool for all individuals to feel empowered. Math has often been a subject where labels are placed on individuals and it divides people by their skin color or their socioeconomic class. Teaching for equity is a way to teach so that the students feel empowered and they see the changes that need to happen and they feel equipped to make a change. “To write the world, students also need a sense of agency, that is, a belief in themselves as people who can make a difference in the world, as ones who are makers of history. Educators working toward an equitable and just society can help students develop not only a sophisticated understanding of power relations in society but also the belief in themselves as conscious actors in the world. Helping young people develop a sense of personal and social agency can be an important step toward achieving equity.” (Gutstein, 2003) Mathematics instruction should be focused on teaching students to be mathematically literate. Being able to read, write, and make sense of the world around them. Teaching for social justice has three main goals: “helping students develop sociopolitical consciousness, a sense of agency, and positive social and cultural identities.” (Gutstein, 2003) In other words being able to “read the world through mathematics, develop mathematical power, and change dispositions toward math.” (Gutstein, 2003) Being able to read the world through math is being able to recognize the inequities that exist and the social and political problems in the local community and within society. Helping the students to develop mathematical power is to help students to understand the complexity of these problems and how math can provide solutions to these problems. By coming up with solutions students are able to recognize the power of math and change the way that they view math to see math as a tool for change. Data Visualization Data visualization focuses on the art of creating a graphic representation. Knowledge about data visualization allows students to create more effective visuals. The main topics of data visualization present in this unit are: Math Background Measures of Central Tendency – There are three mathematical measures of average. Mean, Median, and Mode. To calculate Mean you take the sum of the data values and divide by the total number of values. To calculate the median you record the data values in numeric order and find the middle number. To calculate the mode you identify the data value that repeats most often. When teaching measures of central tendency it is important to teach the students when it is best to use each method. It is best to use mean when you want to describe the middle of a set of data that does not have an outlier. It is best to use median when you want to describe the middle of a set of data that does have an outlier. It is best to use mode when the data values are non-numeric or when you are choosing the most popular item. A histogram is a special type of bar graph that can display data from a frequency table. A histogram has a bar for each interval, and each bar must touch because they represent an entire range. They are a good visual to demonstrate the distribution of data. There are three types of histograms. A uniform histogram is a histogram where the bars are roughly the same height. A symmetric histogram is a histogram where an imaginary vertical line can divide the histogram into two parts that are close to mirror images. A skewed histogram is a histogram that has a peak that is not in the center. It is more developed on one side of the graph A box and whisker plot is a graph that summarizes a set of data by displaying it along a number line. The middle 50% of the data can be found inside the box. 25% of the data is at each end. A box and whisker is a helpful visual because separating data into subsets is a useful way to summarize and compare data sets. A scatter plot shows the relationship between two quantitative variables. The independent variable is represented on the x-axis and the dependent variable on the y-axis. Data from two variables is called bivariate data. Correlation is a measure of the associate between two variables. That ranges from +1 (meaning the two variables move in lockstep in the same direction) to -1 (meaning the two variables move in lockstep in opposite directions) with 0 meaning there is no relationship between the variables. When one variable increases as the other increases, there is a positive correlation. When one variable decreases as the other increases, there is a negative correlation. Mathematical Modeling – Linear Functions Interpreting Categorical & Quantitative Data – Summarize categorical data for two categories and recognize possible associations and trends in the data A line of best fit is a straight line drawn through the middle of a set of data points so that they are equally distributed on either side of the line. (* mathematically it should read so that the set of data points minimizes the sum of the squared errors, but realistically this is a bit above most algebra 1 and algebra 1 students) The line of best fit passes through the point (,) where is the mean of the x-values and is the mean of the y-values. To calculate the line of best fit by hand: To calculate the line of best fit (line of regression) by a graphing calculator: See www.mathbits.com for additional tutorials using the graphing calculator.
Feature
Description
Key knowledge, Understanding, and Success Skills
Content and standards-based knowledge are embedded in overall design of the project, and the project cultivates important skills like problem solving, critical thinking, self-management, and collaborative group work
Challenging Problem or Question
An open-ended question provides the framework for the project. It must be meaningful to the students, be challenging to answer (students shouldn’t be able to Google the answer!), and be sufficiently challenging
Sustained Inquiry
This is not a one day task! A project should include research, resource gathering, application, and creation. It’ll take at least three weeks.
Authenticity
The project should have real work application and be relevant to student interests and issues that affect them
Student Voice and Choice
Students have the opportunity to guide most aspects of their project like team strategy and final decision
Reflection
Reflection is embedded in the process. Students and teachers engage in metacognitive reflection about obstacles, phases of the project, teamwork, quality of the work, etc.
Critique and Revision
Students value both teacher and peer feedback as part of making improvements to their process or product
Public Product
Students make their work public by way of presentation or otherwise making it available to an audience beyond the classroom.
This unit is intended for a high school Algebra 1 class, but could be used in an Algebra 2 class, or an 8th grade Algebra 1 class. This unit is for the beginning of the fourth quarter in the unit on Statistics, but will incorporate review lessons on correlation, scatter plots, and linear regression. Students will need to be able to calculate the mean, median, mode, linear model, range, and frequency of their data. The statistical analysis will guide the visual they use to represent their data with The students will need to be able to explain their decision and their visual presentation and demonstrate that it is based on research. They need to be able to explain why one graph over another provided a better visualization of the data. SWBAT improve their graphs and data displays IOT convey their thesis to the audience
Productive Struggle Tasks: The goal of a productive struggle task if to have a task that all students can access regardless of ability. There are many different ways to approach the given ask and the focus is on the process Do Nows: Utilizing Would You Rather Math; Which Doesn’t Belong; Estimation 180; What Comes next; and Number Talks? Each of these prompts require the students to justify their answer or thought pattern. The focus here is getting students reading, writing, and speaking in math class. Good mathematical processes incorporate being able to defend and justify. Guided Notes: Teacher will present some notes to students with guided examples where the teacher and student work through examples and definitions together Investigations: Students will explore data analysis through the use of locally relevant data Reflection: Throughout the unit the students are expected to reflect on a daily basis. Their reflection could include acknowledging what they learned that day, what they worked on, what they are struggling with, and any questions they have, or just give a general insight into their inner thoughts for the day. Collecting Real Data: Students will utilize the internet to collect data on a sample Making Graphs from Data: Students will create graphs both by hand and on computers. They will be making line plots, histograms, box plots, and scatter plots Analyzing Real Data Data: Students will be calculating measures of central tendency, measures of variation, and regression lines
Prompt 1 – Which doesn’t belong? Justify your answer. Prompt 2 – Keystone Question Puzzle of the day Do Now 2: Prompt 1 – Would you rather? Justify your answer. Prompt 2 – Keystone Question Puzzle of the day Direct Instruction: Reinforce difference between a histogram and a bar graph, why the bars in a histogram touch Example using number of hours per week a group of students spent watching TV; create a frequency table and turn it into a histogram. Prompt the students with the question – what trend does the shape of the data suggest about the weekly television watching of the students Three types of histogram – uniform, symmetric, skewed Guided Practice: Example about money a student spent on lunch over last two weeks. Have students make a frequency table, and a histogram. Have students describe the distribution of the data in the histogram Independent Practice: Analysis of Histograms & Frequency tables Day 2: Direct Instruction: Guided Examples: Lesson 1 Resources: Independent Practice: Analysis of Histograms & Frequency Tables Prompt 1: Which doesn’t belong Prompt 2: Keystone Question Puzzle of the Day Lesson 2 Resources: Math Lab Student Handout Draw informal comparative inferences about two population Prompt 1 – Find an object to complete the incomplete set – Justify your answer Prompt 2 – Keystone Question Activity: This is a follow up to our first activity on comparing high school data where you explored the data using measures of central tendency. Now you are going to examine the current data using line plots and box plots to explore variation in attendance Student Prompts: Complete the Student Activity from the “Community Based Math Project” which explores the high school data using box plots Lesson 3 Resources: Student HandoutLesson 1
Lesson Title
Introduction to Data Analysis
Lesson Length
2 days
Lesson Objective
SWBAT make and interpret frequency tables & histograms IOT search for trends in the data and describe data as symmetric, skewed, or uniform
Statement of Inquiry
How quantities are represented can help define underlying relationships
Enduring Understandings
Introduction
Do Now 1:
Lesson Activities
Day 1
Closure
Reflection: The students complete a reflection where they identify what they have learned, what questions they have, and how they feel about the content
Checks for Understand/Assessment
Collect and mark guided practice about analysis with histograms and frequency tables. Allows the teacher to determine if students are struggling with creating the intervals and if they are able to describe how the data is distributed.
Lesson 2
Lesson Title
Comparing High School Data
Lesson Length
2-3 Days
Lesson Objective
SWBAT examine attendance data on Philadelphia high schools, represent it on a line plot, and calculate the mean, median, and mode IOT explore how attendance and other categories of data vary between neighborhood, citywide admissions, special admissions, and charter schools
Statement of Inquiry
How quantities are represented can help define underlying relationships
Enduring Understandings
Introduction
Do Now:
Lesson Activities
Closure
Reflection: The students complete a reflection where they identify what they have learned, what questions they have, and how they feel about the content
Checks for Understanding/Assessment
Collect and mark math lab handout for the comparing High School Data activity. Allows the teacher to determine if students are struggling with analyzing data and if they are able to make connections between their experiences and the data.
Lesson 3
Lesson Title
Comparing High School Data – Part 2
Lesson Length
2-3 Days
Lesson Objective
SWBAT examine current data on Philadelphia high schools and use line plots and box plots IOT explore variation in attendance and other factors and compare neighborhood, citywide admissions, special admissions, and charter schools.
Statement of Inquiry
How quantities are represented can help define underlying relationships
Enduring Understandings
Introduction
Do Now:
Lesson Activities
Direct Instruction:
Closure
Reflection: The students complete a reflection where they identify what they have learned, what questions they have, and how they feel about the content
Checks for Understanding/Assessment
Collect and mark student handout for the comparing High School Data activity. Allows the teacher to determine if students are struggling with analyzing data and if they are able to make connections between their experiences and the data.
[For additional lesson please see PDF attached above]
Mathematically proficient students make sense of quantities and their relationships in problem situations. Mathematically proficient students can apply the mathematics they know to solve problems arising in everyday life, society, and the workplace. Mathematically proficient students consider the available tools when solving a mathematical problem. Mathematically proficient students try to communicate precisely to others. They try to use clear definitions in discussion with others and in their own reasoning. CCSS.MATH.CONTENT.HSS.ID.A.1: Represent data with plots on the real number line (dot plots, histograms, and box plots). CCSS.MATH.CONTENT.HSS.ID.A.2: Use statistics appropriate to the shape of the data distribution to compare center (median, mean) and spread (interquartile range, standard deviation) of two or more different data sets. CCSS.MATH.CONTENT.HSS.ID.A.3: Interpret differences in shape, center, and spread in the context of the data sets, accounting for possible effects of extreme data points (outliers). CCSS.MATH.CONTENT.HSS.ID.B.5: Summarize categorical data for two categories in two-way frequency tables. Interpret relative frequencies in the context of the data (including joint, marginal, and conditional relative frequencies). Recognize possible associations and trends in the data. CCSS.MATH.CONTENT.HSS.ID.B.6: Represent data on two quantitative variables on a scatter plot, and describe how the variables are related. CCSS.MATH.CONTENT.HSS.IC.B.4: Use data from a sample survey to estimate a population mean or proportion; develop a margin of error through the use of simulation models for random sampling. CCSS.MATH.CONTENT.HSS.IC.B.6: Evaluate reports based on data.Standards
CCSS.MATH.PRACTICE.MP1 Make sense of problems and persevere in solving them.
CCSS.MATH.PRACTICE.MP2 Reason abstractly and quantitatively.
CCSS.MATH.PRACTICE.MP4 Model with mathematics.
CCSS.MATH.PRACTICE.MP5 Use appropriate tools strategically.
CCSS.MATH.PRACTICE.MP6 Attend to precision.
Summarize, represent, and interpret data on a single count or measurement variable
Summarize, represent, and interpret data on two categorical and quantitative variables
Make inferences and justify conclusions from sample surveys, experiments, and observational studies
Brock, Annie, and Heather Hundley. The Growth Mindset Coach: A Teacher’s Month-by Month Handbook for Empowering Students to Achieve. Berkeley, CA, Ulysses Press, 2016. This resource provides research about the benefit of providing students with real world problems. It discusses the importance of having the students be an active part of their math education D’Ambrosio, Ubiratan. “What is ethnomathematics, and how can it help children in schools? Teaching Children Mathematics.” Reston, Feb. 2001, vol. 7, issue 6, pp. 308 – 311. This resource provides background knowledge on what ethnomathematics is. It also talks about the benefits of approaching instruction from a ethnomathematics standpoint Gutstein, Eric. “Teaching and Learning Mathematics for Social Justice in an Urban, Latino School.” University of Illinois—Chicago Journal for Research in Mathematics Education, 2003, vol. 34, no. 1, pp. 37–73. This resource provided the background knowledge as to why it is beneficial to teach math using social justice. It identifies strategies to incorporate social justice and it also provides research acknowledging the benefits to the students Knaflic, Cole Nussbaumer. Storytelling with Data: A Data Visualization Guide for Business Professionals. Hoboken, NJ, Wiley, 2015. This resource provides information about Data Visualization and the process of improving data displays. Murrell, P. C., Jr. Digging again the family wells: A Freirean literacy framework as emancipatory pedagogy for African American children. New York, Peter Lang Publishing, 1997. This resource provides information about teaching using social justice. It defines what teaching from a social justice standpoint can include. It discusses validating the culture, language, and identity of your students in the work and assignments that they are completing. Wesch, Michael. “From Knowledgable to Knowledge-able: Learning in New Media Environments.” Academic Commons, Jan. 7, 2009, http://www.academiccommons.com.org/2014/09/from-knowledgable-to-knowledge-able-learning-in-new-media-environments. This source provides information and research about evolving the structure of math education. It stresses the importance of moving away from a passive learning style and have the students participate in more active learning. “What is Project Based Learning (PBL)?” Buck Institute for Education, http://bie.org/about/what_pbl This site is a resource focused around project based and problem based learning. It provides the background as to why this is a strong method of structuring classes and units. This resource gave me the components that a project based unit should have.