
The purpose of this curriculum unit is to increase a high school student’s awareness of electricity; how it is measured and the amount that is used. The unit strives to apply quantitative tools to a scientific context by investigating and analyzing various aspects of electricity sources and usages.
After learning to measure electricity using an energy monitor and various types of light bulbs, the students will read an article about a village in India that has no electricity and discuss the ramifications. Students or student teams will use a choice board for project topics and presentation methods to research electricity themed issues and present their findings to the class. The research presentation must include data analysis and data displays.
The hope for the unit is that students will internalize their findings and those of their classmates and make real world connections for their future.
The more details students learn about electricity, its sources, its production, its availability and the impact on the environment, the more involved they are likely to become in some aspect of it. In the TIP seminar “Penn Laboratory on Energy, Sustainability and Environment” we used a Fermi questions to explore multiple topics in energy, sustainability and the environment. There were assignments that allowed the fellows to explore the intricacies of a problem and personalize it, realizing that there is more than one solution and more than one way to approach an outcome. One of the ways this curriculum unit hopes to arouse interest is by giving students a choice for their research. The only requirements are that they display and analyze the data they collected or researched. It is the hope that through the preparation of their presentation or from the presentations of their peers that topic of electricity becomes real to them. The Next Generation Science Standards makes the following statement about making connections to the Common Core State Standards for Mathematics. “During the middle school and high school years, students develop a number of powerful quantitative tools, from rates and proportional relationships, to basic algebra and functions, to basic statistics and probability. Such tools are applicable far beyond the mathematics classroom. Such tools can also be better understood, and more securely mastered, by applying them in a variety of contexts. Fortunately, the NRC Framework makes clear in its Science and Engineering Practices (Analyzing and Interpreting Data, Using Mathematics and Computational Thinking) that statistics and mathematics have a prominent role in science. NGSS aims to give middle school and high school science educators a clear road map for how they can prepare their students for the quantitative demands of college and careers, where students need to apply quantitative tools in an applied or scientific context. For all these reasons, NGSS requires key tools from Grades 6−8 and High School Common Core to be integrated into middle school and high school science instructional materials and assessments.” This curriculum unit could be done solely in a physics or statistics class, without the collaboration. It may be more difficult for the statistics teacher, but it is possible to de-emphasize some of science of electricity depending on the research topic they choose. A minimum review of “how electricity is measured” will be necessary.
This unit is designed for a high school statistics class. In my school, the seniors take statistics as a 5th year math elective. All seniors must also take physics, so this unit is designed for collaboration between the math teacher and the physics teacher. The unit could be adapted for use in any math or science class where real life issues are explored or emphasized. The overall objectives of the lesson is to apply statistics to data collected or researched in order to display, analyze and make inferences for the future. The specific objectives for the unit will include:
The suggested strategies for this unit are meant to give the students freedom and independence. Academic choice helps engage and motivate students. It allows for creativity and exploration into areas of interest. The more students have choice in assignments, the more responsibility and ownership they have. The research topics suggested all contain the directions to investigate and analyze. This also allows freedom. The teacher or student will have to answer the question “how deep?” One of the most rewarding things for me when investigating is to extend the thread further and further and wind up with at least 10 tabs open on my driver. In the olden days I would do the same with encyclopedias! The analysis will depend on the level of the students’ knowledge in statistics. A simple analysis such as the mean kilowatt hours of electricity used for 12 months could be sufficient, or perhaps a more complex analysis such as the standard deviation of electricity usage from school to school.
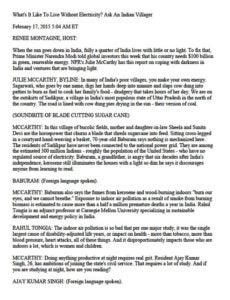
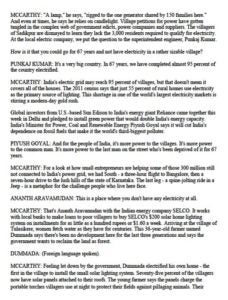
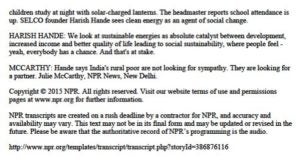
Lesson 1 How is electricity measured? Learning Objective: At the end of this lesson students will be able to use an energy monitor to measure the amount of electricity used by various types of light bulbs Materials: Procedure: Lesson 2 What is it like to live without electricity? Ask an Indian Villager. Learning Objective: At the end of this lesson students will be able to discuss the five essential elements of the article/interview by Julie McCarthy (the characters, the setting, the plot, the conflict and the resolution). Materials: Procedure: Lesson 3 Research topics based on the NPR story ““What’s It Like To Live Without Electricity? Ask an Indian Villager.” or other topics about electricity production and usage Learning Objective: At the end of this lesson students will be able to display and analyze energy data they collected or researched for a presentation to the class. Materials: Procedures: Endnotes This unit is intended for an interdisciplinary physics and statistics class, which assumes the students know something about electricity. If this is not the case and some more lessons in electricity are desired, I have provided the following outline of how it could be done.
NGSS Lead States. “Next Generation Science Standards: For States By States” Appendix-L_CCSS Math Connections 2013 Achieve, Inc. http://www.nextgenscience.org/ “What’s It Like To Live Without Electricity? Ask An Indian Villager.” Goats and Soda/Morning Edition. NPR. February 17, 2015. Radio. http://www.npr.org/templates/transcript/transcript.php?storyId=386876116 Used with permission from NPR, 1111 North Capitol St., NE, Washington, DC 20002 Annotated Bibliography for Teachers Reflection Questions – maybe ask students to answer 1 or 2 from each category http://www.edutopia.org/resource/40-student-reflection-questions-download http://www.iclimate.org/ccc “Your Families Carbon Footprint” Copyright©2008 Purdue University – this may provide a topic for students http://www.yale.edu/ynhti/curriculum/units/1989/7/89.07.01.x.html#top Teaching some basic concepts of electricity http://www.energylens.com/articles/ BizEE Energy Lens – they are actually selling energy management systems, which is not why their link is there. Much of their background information is straight forward. http://www.nmsea.org/Curriculum/Listing.htm New Mexico Solar Energy Association; Summary of Solar Energy Curriculum; Energy Physics Primer http://www.ucsusa.org/clean_energy/our-energy-choices/how-is-electricity-measured.html#.VQStcGaay24 Union of Concerned Scientists; How is Electricity Measured http://www.yale.edu/ynhti/curriculum/units/1989/7/89.07.01.x.html#top Teaching some basic concepts of electricity http://www.need.org/ The National Energy Education Development Project; The NEED Project P.O. Box 10101, Manassas, VA 20108 1.800.875.5029 http://www.parks.ca.gov/pages/501/files/unit.pdf California Department of Parks and Recreation; A Teaching unit on Electricity featuring the Folsom Power House© 2002 by Steve Gregorich
Electricity Project Choice Board ● A bibliography ● a data display ● a data analysis ● a presentation (see other side) ● a reflection on your learning (completed by each individual) What Is It Like to Live Without Electricity – Project Choice Board Electricity Presentation Choice Board Don’t forget to include a data display! What Is It Like to Live Without Electricity – Presentation Choice Board What Is It Like to live Without Electricity Project Grading Rubric (- 5 points per late day) * The presentation can be graded separately and counted as an additional assessment. Please see Presentation Rubric.
Investigate and analyze how energy/electricity is wasted in your home, your school or your area.
Investigate and analyze the introduction of electricity in your area. How did people and their things have to adapt?
Investigate and analyze the electricity used in your house over the last year.
In 2008, then Vice President, Al Gore, challenged our nation to repower America with 100 % carbon-free electricity within 10 years. Investigate and analyze the country’s progress.
Every project must include:
Choose a city, village or town that does not have reliable electricity. What are the long-term effects? What suggestions would you have to supply electricity?
Investigate and analyze and compare the electricity usage and sources in a green school vs. a regular school. (You may substitute a home or business for a school)
Investigate, analyze and explain energy efficient appliances. Compare them to older appliances.
Investigate and analyze the electricity usage of a school or business in your area.
Create a PowerPoint or prezi
Create a comic book
Create a commercial
Create and perform or record a drama
Project Presentation Choices:
Create a pamphlet or brochure
Create an interactive game
Create a science fair poster
Create and perform or record a talk show scenario
Task
Points Possible
Points Earned
Project completed on time
20
Bibliography accurate and complete with at least ___ sources
20
Data display present and accurate
20
Data analysis present and accurate
20
Personal Learning Reflection present and thorough.
20
Presentation*
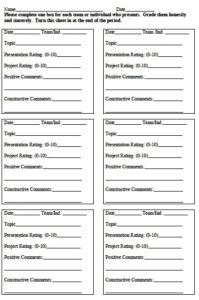
PRESENTATION SCORING RUBRIC FOR TEAM/PARTNERS
Date: Topic:
Members Present:
Members who prepared materials but are not present:
POSSIBLE POINTS
POINTS EARNED
a. Summarize topic
20
b. Detailed explanation of topic
20
c. Correct details
20
d. Data displayed and correct
10
e. Materials neat and easy to read & follow
10
f. All team members understand
10
g. Team members interact well with class
10
h. Above and beyond bonus points
Total points
PRESENTATION SCORING RUBRIC FOR INDIVIDUAL
Date: Topic:
Individual Presenter:
POSSIBLE POINTS
POINTS EARNED
a. Summarize topic
20
b. Detailed explanation of topic
20
c. Correct details
20
d. Data displayed and correct
20
e. Materials neat and easy to read & follow
10
f. Presenter interacts well with class
10
g. Above and beyond bonus points
Total points
From the Common Core State Standards for Mathematics Statistics and Probability – S-IC 2. Understand statistics as a process for making inferences about population parameters based on a random sample from that population. Statistics and Probability – S-IC 3. Recognize the purposes of and differences of experiments, and observational studies; explain how randomization relates to each. From the Next Generation Science Standards 9-12 Connection Statements Modern civilization depends on major technological systems, such as agriculture, health, water, energy, transportation, manufacturing, construction, and communications. Practices for Context Science and Engineering Practice – 9-12 Condensed Practices Apply concepts of statistics and probability from the High School Common Core State Standards (found in S) to scientific and engineering questions and problems, using digital tools when feasible. HS.PS3 Energy As part of this work, teachers should give students opportunities to reason quantitatively and use units to solve problems, and apply key takeaways from grades 6–8 mathematics: Quantities (N-Q) / Reason quantitatively and use units to solve problems: N-Q.1. Use units as a way to understand problems and to guide the solution of multi-step problems; choose and interpret units consistently in formulas; choose and interpret the scale and origin in graphs and data displays. N-Q.2. Define appropriate quantities for the purpose of descriptive modeling. N-Q.3. Choose a level of accuracy appropriate to limitations on measurement when reporting quantities. HS.LS2 Ecosystems: Interactions, Energy, and Dynamics As part of this work, teachers should give students opportunities to reason quantitatively and use units to solve problems, represent quantitative data, and apply key takeaways from grades 6–8 mathematics: Quantities (N-Q) / Reason quantitatively and use units to solve problems: N-Q.1. Use units as a way to understand problems and to guide the solution of multi-step problems; choose and interpret units consistently in formulas; choose and interpret the scale and origin in graphs and data displays. N-Q.2. Define appropriate quantities for the purpose of descriptive modeling. N-Q.3. Choose a level of accuracy appropriate to limitations on measurement when reporting quantities. Science examples: (1) Recognize the difference between intensive and extensive quantities (e.g., a quantity with units of tons/acre is insensitive to the overall size of the area in question, unlike a quantity with units of tons). (2) Carefully format data displays and graphs, attending to origin, scale, units, and other essential items. Interpreting Categorical and Quantitative Data (S-ID) and Making Inferences and Justifying Conclusions (S-IC). From the PA Reading, Writing, Listening and Speaking Standards 1.2. Reading Critically in All Content Areas 1.2.11 B. Use and understand a variety of media and evaluate the quality of material produced. 1.4 Types of Writing 1.4.11 B. Write complex informational pieces (e.g., research papers, analyses, evaluations, essays). 1.5 Quality of Writing 1.5.11 B. Write using well-developed content appropriate for the topic. 1.6 Speaking and Listening 1.6.11 A. Listen to others.