
This curriculum unit was designed to accompany Common Core literacy standards using an approach not often associated with literacy- the infographic. The idea is to introduce students to infographics, guide them to use critical thinking to create them, and ultimately, as lifelong learners, be prepared to evaluate the structure and design of the infographics they will encounter in the media as they get older. This unit is written using 4th grade ELA standards associated with character traits, but could be adapted to older and younger audiences. Furthermore, this unit suggests that using infographics with ESL and special education students could help them develop comprehension skills even though their reading and writing skills may not be on grade level.
Infographics are a mix of images, charts, and text seen widely in contemporary magazines, newspapers and on the Internet. The frequent use of infographics speaks to their versatility and the multitude of advantages they offer. Infographics synthesize large amounts of information into smaller, more accessible pieces (Mayer, 2001) that especially appeal to visual learners. The human brain processes images faster and visual memories are more indelible (Potter, 2014), so infographics create a more immediate and longer lasting impression on readers. These studies support the fact that right now people prefer information and news in graphic form (Pew, 2016). Students need to be familiar with how to read and evaluate such data and information visualizations (Trumbo, 1999) in order to be lifelong learners. It’s not a given that everything that calls itself news is in fact genuine and accurate. Our students will need to be able to automatically discern the difference between real and fake information as adults. The persuasive power of infographics could be used to spread misinformation unless people are trained to interpret and think critically about the information provided. These evaluation skills come from learning and training[1]– it is not innate. Within education, the use of infographics is not as widespread. Our allegiance to more traditional methods of delivery and assessment are partly responsible for the lack of adoption of infographics. Most teachers subscribe to a pedagogy that practices formal reading and writing. While these skills are necessary, they are clearly not the only skills students need to learn. Jobs today and of the future require critical thinking and creativity more than ever. It is our responsibility as educators to prepare students for these jobs by creating environments where applying multiple, creative strategies across and beyond core subjects takes place routinely so that students are equipped to integrate concepts from art, math, literacy, science, and social studies in order to produce academic works. There are several benefits to using infographics in a classroom. As a tool for concept delivery, research suggests that infographics motivate students to stay engaged in the learning process and that they many prefer them to traditional delivery methods such as textbooks (Bicen, 2017). In essence, infographics are a solution to engaging with students who may struggle with traditional methods of comprehending content. Also, infographics increase motivation engagement (Wolfe & Kleijwegt, 2012) which is imperative since motivation for struggling readers is difficult to maintain. Robertson, et al, (2013) offered as evidence to support the idea that without high enough levels of motivation, struggling readers will not engage. They conclude that: “The centerpiece of traditional approaches to assisting struggling readers has been to change the curriculum, but such practices have failed to lead students to higher levels of reading and knowledge acquisition. To meet this challenge calls for a reconceptualized view of effective reading instruction that incorporates greater intensity and cognitive challenge and promotes students’ motivation to engage in literacy-based instructional activities and persist in the hard work of school.” Infographics work in all kinds of classrooms. As they break the monotony of teaching standards the same way year after year, infographics have been used cross-circularly (Lindblom, 2016). Infographics tell a story through examination and students can be tasked with telling what that story is (Krum, 2014) whether it’s the story of immigration in the United States or the personality of a character in a book. Conversely, students can create them in order to tell their own story. More traditionally used in science to explain phenomena (ie. how a beehive functions) or bring attention to issues of a scientific nature (i.e. the impact of global warming), infographics have successfully been integrated into literacy as a means for not only explaining nonfiction, but to decompose fiction (Lindblom, 2009). Infographics, by design, are an amalgam of the best of what we want and should expect from our students-high impact learning. They are carefully crafted with the end user in mind, seeking to add to the knowledge of their audience in ways that are more easily understood and leave a lasting impression. This unit seeks to make the case that not only are infographics worthy tools to be implemented in classrooms far and wide, but that for some students, ESL and struggling readers in particular, they are better choices than traditional reading delivery methods and writing assessments because, according to Krauss (2012) “infographics strike the sweet spot”: Literacy standards by 4th grade are almost exclusively geared toward comprehension skills, but reading and comprehension are not mutually inclusive skills. There are students that have aural comprehension without a matching level of reading mastery. Those are the students that answer questions based on a read aloud or lecture, but fail to show the same level of competency on a paper and pencil test for comprehension or understanding. Additionally, there are students that comprehend, but cannot express their level of understanding due to language barriers or deficiencies. Those are your students who literally do not have sufficient language and writing skills to complete a constructed response or essay. The use of infographics in the classroom as an assessment of comprehension is one strategy to support these students, because although they do not rely heavily on traditional writing structures, infographics require the critical thinking part of any task to which they are linked because they require students to choose which information is presented and how best to present it. Additionally, being presented with an infographic to explain or retell information taught in a traditional format helps those students because the images can solidify ideas about the material that students had difficulty reading. Using infographics also increases critical thinking skills in general (Krauss, 2012) because of the skills used to create and evaluate infographics. Utilizing infographics increases the inclusion of students who may otherwise be left behind because they are not yet proficient at reading. Infographics in literacy may help teach comprehension skills to students that are not on-grade-level readers. In summation, I believe the inclusion of infographics in the classroom would be of such benefit to students that every teacher, across grades and subject areas, should utilize them. They can motivate, stimulate, and support students as they work toward standards mastery.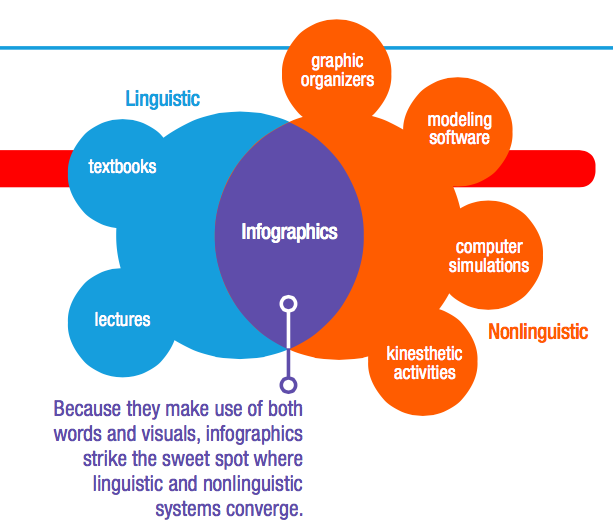
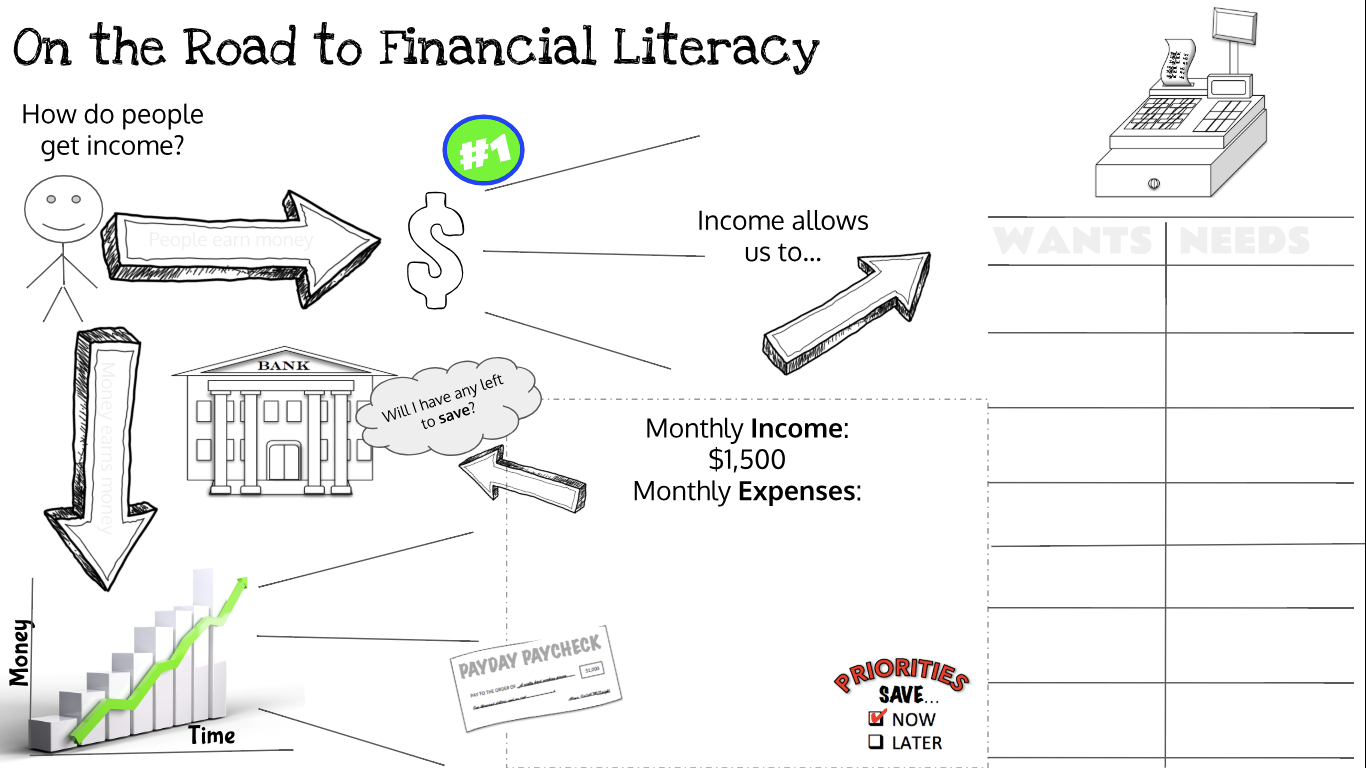
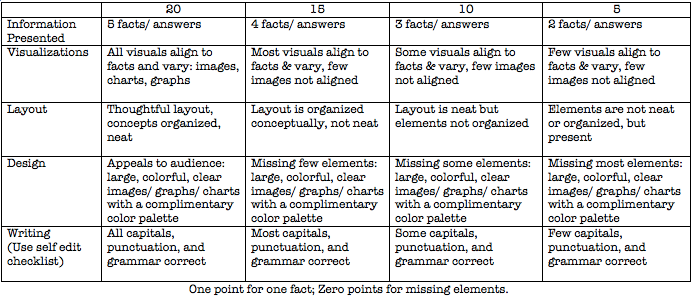
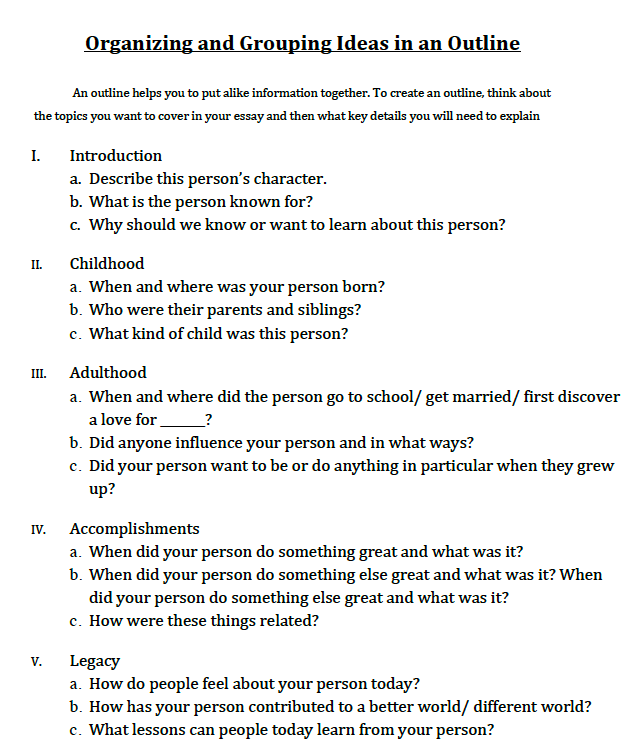
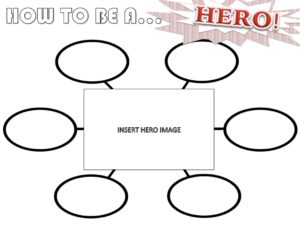
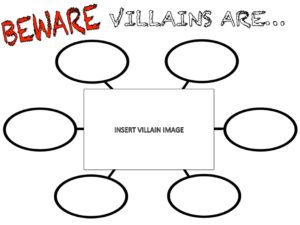
An infographic “is an assemblage of knowledge that utilizes images, charts, graphs, maps, text, numbers and characters to transform data into visually accessible messages” (McCormick, 2017). Due to all these components, infographics can be fun as well as informative. A well done infographic is a great tool for quickly providing information. Infographics also provide an opportunity for students who struggle with standard expressions of mastery (i.e. essays and reading comprehension tests) to literally show what they know. With or without the aid of technology based applications, students can create infographics that are visually stimulating and confer complicated concepts and ideas succinctly and thoroughly. I propose using infographics in literacy for all reading levels, but with specific benefits for struggling readers as they master other literacy concepts. The use of infographics can aid students in gaining and expressing an understanding of more complex ideas. For example, infographics can be used by students identifying and reporting character traits begotten from inferencing. There are several steps in creating an effective infographic. However the amount of support students receive can and may vary by subject matter and grade in order to grow your students into great creators of infographics. When beginning to use infographics, the experience can range from students filling in an infographic that is missing particular parts (Fig. 1) or being given all the components and tasked with assembling them to creating an infographic from scratch. When creating an infographic is a part of the objective, in general, students can get started by focusing on four basic steps: Figure 1: Fill in the blank/ guided notes infographic. Choosing a topic may be a tall order and the amount of varying topics may present a difficult task when it comes to grading, but including a step-by-step directions, an example, and a rubric (Fig. 2) can minimize student confusion and expedite the evaluation of projects. For example, students may be allowed to choose a topic when preparing for something like National History Day, when the only guidelines are format and students can inform about anything. An infographic can be graded as their classwork leading up to their final presentation. Figure 2: Example of 4th grade rubric to be used by students to create and teachers to assess infographics where the infographic is part of the focus. Included here is a more subjective rubric with Likert rated criteria. Student research can look many ways. Teachers can provide the material from which students must decipher the facts they ultimately want to use. Students can use the internet with guidance to find their information on their own. Or yet another way is for students to use books strategically given to them or by visiting the library on a fact finding mission. Choosing which facts to include in their infographic is where the first part of critical thinking comes into play and where some difficulty may arise as students learn to trust their ability to make decisions about what they’ve learned. The process of students conducting research may best be taught through a gradual release process so that they comply with the expectations of the teacher and course. Providing an outline will help students zero in on what facts and information they need to include. Outlines can be created by the teacher or as a whole-class created shared document (Fig. 3). Figure 3: Example of an outline used to introduce how to structure a biographical essay. When students have to choose images or create graphs to represent the facts they want to report, critical thinking really becomes an added benefit of using infographics. Nouns can easily be represented by images, but visualizing ideas and concepts make this step a challenge. Be prepared to support students at this step depending on their levels of competence. One way to address this higher order thinking step is to have done a whole class lesson to create an infographic where they receive the images when starting out and have them come up with the facts. The last step, presentation, is where art and design can be included in the lesson. Websites with infographic templates take a lot of the design aspect of this step away because palettes and layouts are already present, but do not completely eliminate it. If students use digital templates, they must still choose one that aligns and /or compliments their project and can accommodate the facts and information they choose to use. The use of infographic templates can be a helpful first step or when the focus isn’t the infographic itself. If students are creating theirs from scratch, either on paper or digitally, learning about complementing colors and mood can be fun. Examining, comparing, and evaluating infographics can help students create better infographics while continuing to hone their critical thinking skills. Lastly with this step it is important to note that the amount of information and the size of images and charts must be considered. Sometimes less is more, but sometimes less isn’t enough and vice versa. Creating an infographic using your own directions and self-made rubric will be a great way to ensure that as a teacher you haven’t left out anything or that there’s not too much being asked of students. As mentioned previously, another approach to using infographics across the curriculum is to create the infographic with missing elements and have students fill them in, either as guided notes or as an assessment. In that case, the teacher takes on the task of thinking critically about content and design. While the four basic steps are still a guide and examples abound online, here are a few tips to help teachers help their students when using pre- or self-made infographics: When creating an infographic to accompany a lesson, think of it as pulling back on the focus of the topic to show the path of getting there. In other words, allow images to represent not only what students are learning, but what they have already learned so that those images guide them to learn the new content. This approach will enable the infographic to include more elements of a complete lesson by accessing prior knowledge and not “just the (new) facts”. When presenting students with a partially done infographic, there is the risk that it will have less impact then creating their own. To mitigate this, create an infographic that can not only have student added text, but can be colored. Color has been linked to increased memories for decades (Dzulkifli, 2013), so not overlooking this step can benefit students greatly. Using content or domain specific language or vocabulary words is an integral part of many lessons. If printed infographic templates are given to students as guided notes, turning the typeface of those words gray will ensure that students associate the correct word with the correct image or fact. Students can then trace the word(s) in color for an even more lasting effect. Although the proposal of using infographics presented here supports the use of infographics for several standards across several grade levels from K to 12th, in particular it will address specific 4th Grade Common Core Standards. Within the reading standards, use focuses on pulling details from the text and either listing or organizing details in order to analyze them. Within the writing standards, use focuses on the graphic organization and data visualization of information and pre-writing, when applicable. For ESL students, Special Education students, and struggling readers, the focus is on applying a range of skills to fictional and nonfictional texts that have been read aloud. The lessons herein constitute a unit on character traits. The lessons start from identifying character traits, moves through how to identify them (inferencing), and then how to graphically represent them.
In this section, teaching character traits is explained. Objectives are stated in the “Students will be able to…in order to…” (SWBAT) format. Bloom’s Taxonomy of Higher Order Thinking Verbs are used to order the strategies suggested. SWBAT draw on specific details (e.g., a character’s thoughts, words, or actions) IOT describe in depth a character, setting or event in a story or drama. Teaching character traits evolves over grades. In kindergarten, students learn to identify characters. In first grade, they learn to describe characters. In second grade, they describe how characters respond to events. In third grade, they describe the characters and begin to think about traits, motivations, and feelings. By fourth grade, students need to describe characters in depth. In order to accomplish this, students need to both identify details (actions and dialogue) in the text that allow for interpretation and use inferring to connect the actions and dialogue to traits. A review of the previously learned character trait skills prior to the further development of this skill in 4th grade is warranted. Figure 4: Example of a graphic organizer for hero and villain character traits. SWBAT interpret information from different formats IOT explain how the information contributes to an understanding of the text in which it appears. SWBAT refer to details and examples IOT draw inferences. SWBAT draw on specific details (e.g., a character’s thoughts, words, or actions) IOT describe in depth a character, setting or event in a story or drama.
Strategies for Identifying Character Traits (Review)
Recall & Review
Recall & review characters with obvious traits (heroes & villains)
Categorize
Sort known characters that possess specific traits through group discussion
Justify
Students justify traits
Demonstrate
Create a mini-poster/ worksheet of a well-known hero or villain surrounded by their traits (Fig. 4)
Strategies for Inferencing
Define
Introduce and define the concept of inferencing
Develop
Provide opportunities for students to make inferences
Justify
Students justify their inferences based on evidence
Strategies for Making Inferences About Character Traits
Recall & Review
Recall and review character traits from a list
Brainstorm
Brainstorm specific character traits through group discussion
Justify
Use inferencing to provide evidence/justify traits
Demonstrate
Create a word web graphic organizer with character traits and evidence.
Character Traits Data Visualization
Justify
Students justify traits by finding evidence from text
List
Evidence is listed
Measure and Enumerate
Text evidence is tallied.
Qualitative data becomes quantitative data.
Calculate
Students calculate proportion of traits as a percentage
Construct
Students visualize data by constructing a graph
Even though these lessons are written specifically with the ReadyGEN 4th grade curriculum in mind, they can be extrapolated for other texts and grades. These lessons are also introductory lessons that introduce data visualization, which is the creation of graphics to portray numerical data. The focus of these lessons is more on character traits and the infographic is the supporting material. Ideally the goal here is to have data visualizations that serve as a source that instantly show the personality of a character based on the amount of specific character traits they possess. NOTE: The Madeline Hunter Model of Mastery Learning is used for lesson planning. There are several videos on YouTube that guide a lesson through this skill or teachers can use some of their choosing. MeDaRo ED’s True Move Commercial, Amy Ginder’s Partly Cloudy, and Teal Carter’s Inference Video are good examples. [For additional lesson plans and appendices please see PDF attached above]
Heroes vs Villains: Identifying Character Traits (Review)
Standard
CC. 1.3.4.C Describe in depth a character, setting or event in a story or drama, drawing on specific details in the text.
Objective(s)
SWBAT draw on specific details (e.g., a character’s thoughts, words, or actions) IOT describe in depth a character, setting or event in a story or drama.
Lesson:
How can you tell a hero from a villain?
Anticipatory Set
Teacher leads discussion recent children’s films. Students name their favorites. Teacher asks: How can you tell a hero from a villain? A good guy from a bad guy?
Objective and Purpose
“The purpose of this lesson is for you to identify the traits of a character from one of your favorite animated movies and support the choices you made.”
Input
Students will be asked to identify and choose a character (possibly from a slide of choices) in order to create a character traits web.
Modeling
Teacher chooses and draws a character in the center of a blank page. Then thinks aloud about the kind of person the character is and writes some words around the character in the style of a word web.
Checking for Understanding
Teacher writes a few words that may not fit and asks students if there are any words that might not belong on the web. Teacher guides as needed, crossing off traits that do not align to the character.
Guided Practice
Teacher tasks students to help do another well-known character. This time students take turns coming to add words.
Independent Practice
Students are tasked with choosing character (possibly from a slide of choices). They are asked to identify a set amount of traits.
Variation: after students have drawn their characters, a slide can be displayed with a list of character traits from which to choose.
Closure
Students are asked to share the character they chose, one trait they identified, and give one reason why they chose that trait. Sharing can be done whole class, with their table, partner, etc.
Caring is Contagious: Inferencing
Standard
CC.1.2.4.B Refer to details and examples in text to support what the text says explicitly and make inferences.
Objective(s)
SWBAT refer to details and examples IOT draw inferences.
Lesson:
How to make inferences?
Anticipatory Set
Teacher leads discussion about making an inference (versus a conclusion). “If I walked into class wearing a raincoat, what would you think?” (“What would be the difference if I walked in here wearing a raincoat and I walked in here dripping wet?”) How do you know?
Objective and Purpose
“The purpose of this lesson is for you to practice making inferences. An inference is when you use what you know and what you’ve read to come up with a new idea about something. I know that when it is going to rain, I wear a raincoat and I see that my teacher has a raincoat on, so I think it might rain today.”
Input
Students will watch a series of short clips and make inferences as they watch.
Modeling
Class watches True Move Commercial and teacher makes first inference at 0:12 seconds: “I wonder why he stole something for his mom? Maybe she needs something but doesn’t have the money to afford it and it’s important.”
Checking for Understanding
Teacher tasks students for the elements that informed their inference. What I read (or saw) + What I know = An inference becomes Seeing a bot steal for his mom + If I stole something my mom needed it would be because it must’ve been really important and we didn’t have the money to pay for it.
Guided Practice
Teacher draws attention to the other places in this commercial where inferences can be made. Students can do Turn and Talk as well.
Independent Practice
Students are tasked with making the last inference: why does the doctor pay the bill?
Closure
Students watch a follow up video doing all the inferencing. An exit ticket can be used that includes a detail from the film and a place for the inferencing equation to be filled in.
4th Grade Literacy CC.1.2.4.B Refer to details and examples in text to support what the text says explicitly and make inferences. 4th Grade Math CC.2.4.4.A.2 Translate information from one type of data display to another.
Bicen, H. (2017). The Psychological Impact of Infographics in Education, Retrieved from https://www.edusoft.ro/brain/index.php/brain/article/viewFile/733/821 Dzulkifli, M. A., & Mustafar, M. F. (2013). The Influence of Colour on Memory Performance: A Review. The Malaysian Journal of Medical Sciences : MJMS, 20(2), 3–9. Krauss, J. (2012). Infographics: More than Words Can Say. Learning & Leading With Technology, 39(5), 10-14. Lindblom, K., Galante, N., Grabow, S., & Wilson, B. (2016). Composing infographics to synthesize informational and literary texts. English Journal, 105(6), 37-45. Retrieved from https://search-proquest-com.libproxy.temple.edu/docview/1808331073?accountid=14270 Mayer, R. E. (2001). The Cambridge Handbook of Multimedia Learning. New York: Cambridge University Press. McCormick, M. R. (2017). Infographics work to effectively communicate the LCAP process. Leadership, 46(5), 32-34 Mitchell, A., Gottfried, J., Barthel, M., Shearer, E., (2016). The Modern News Consumer. Retrieved from http://www.journalism.org/2016/07/07/pathways-to-news/ Potter, M., Wyble, B., Hagmann, C.E., McCourt, E.S. (2014). Detecting meaning in RSVP at 13 ms per picture. Psychonomic Society, Inc Trumbo, J. (1999). Visual Literacy and Science Communication. Science Communication, 20(4), pp. 409 – 425. Retrieved from https://doi-org.libproxy.temple.edu/10.1177/1075547099020004004 Wolfe, P., & Kleijwegt, D. (2012). Interpreting Graphic Versions of Shakespearean Plays. The English Journal, 101(5), 30-36. Retrieved from http://www.jstor.org/stable/23269525