
Elements of natural substances are constantly cycling through Earth. Water, carbon and nitrogen move through Earth’s many ecosystems in closed paths called the biogeochemical cycles. Human activities have changed Earth’s environment in many ways. These impacts are multifaceted and are complex cause and effect relationships. In this unit, we will explore only one of these activities (modern agriculture) and its impact on the water, carbon and nitrogen cycles.
By analyzing intensive farming techniques, students will learn about the biogeochemical cycles and the impact modern farming has had on these cycles. Pushing students to understand this concept in detail will add significant depth to a concept that is often oversimplified. This unit is intended for Biology students in Grades 9 or 10.
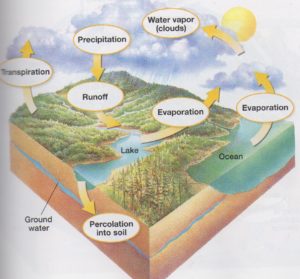
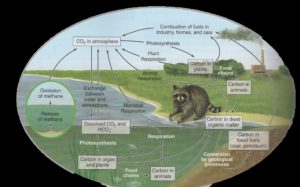
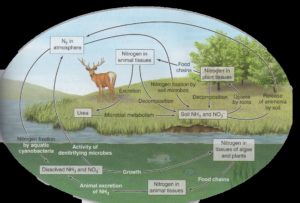
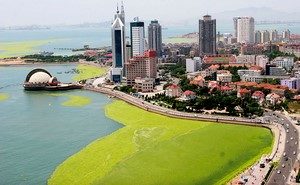
The biogeochemical cycles operate on a fixed amount of matter on Earth. While the total amounts of water, carbon and nitrogen do not change, these substances exist in many different forms. Water is found on Earth as solid ice, liquid water or gaseous vapor. Carbon and nitrogen both exist as in the atmosphere as carbon dioxide gas and nitrogen gas, respectively, or as an integrated part of living and non-living substances. The hydrologic or water cycle describes the constant movement of water through Earth and its atmosphere. Major processes of the cycle include: Source: Biology, “The Water Cycle”, Holt, Rinehart and Winston, 2004, Print, pg 35 The carbon cycle is a straightforward process that describes the movement of carbon through Earth’s ecosystems (see Figure 1 below). Carbon is a major component of all living organisms. In fact, almost 20% of the human body weight is carbon (Raven 1208). Figure 1: The Carbon Cycle. Source: Biology, “The Carbon Cycle”, McGraw Hill, 2014, Print, pg 1208 Nitrogen is an essential element of all living organisms. Heterotrophs (like humans and rabbits) get the nitrogen needed to build protein and nucleic acids by eating food. Autotrophs (like plants) get the necessary nitrogen by absorbing nitrates (NO3–) and ammonia (NH3) in the soil through their roots. In many ecosystems, nitrogen is the chemical element shortest in supply. Even though nitrogen gas (N2) makes up 78% of the atmosphere, most living organisms are unable to use the nitrogen in this form (Raven 1210). Prokaryotes convert the nitrogen gas into useable forms of nitrogen (see Figure 2). Figure 2: The Nitrogen Cycle Source: Biology, “The Nitrogen Cycle”, McGraw Hill, 2014, Print, pg 12011 Human activities have changed Earth’s environment in many ways. These impacts are multifaceted and are complex cause and effect relationships. In this unit, we will explore only one of these activities (intensive farming) and its impact on the water, carbon and nitrogen cycles. Intensive farming is a type of modern farming that refers to the industrialized production of livestock, poultry, fish and crops. It results in a large amount of food produced per acre, as compared to other subsistence farming patterns. This unit will focus on five intensive farming techniques farmers practice to produce large quantities of vegetables and livestock: irrigation, deforestation, pesticide use, fertilizer use and agricultural machinery use. Irrigation is the process of artificially applying water to soil to allow for plant growth. Irrigation transports water to crops to increase yield, keep crops cool under excessive heat conditions, and prevent freezing. Often times, this process makes agriculture possible in arid or dry regions, areas that may have initially been unsuitable for growing crops. Deforestation is the clearing of forests on a large scale, to provide more room for planting crops or raising livestock. Removing trees at such a massive scale can result in negative effects on the environment. It can lead to a loss of habitat for millions of species, promote desertification in certain areas (by eliminating transpiration), as well as drive climate change (National Geographic 2013). With fewer trees to absorb greenhouse gases, more will enter the atmosphere, fueling global warming. Pesticides are any substances that are intended to prevent, destroy repel or mitigate any pest, in order to increase productivity of crops. They include insecticides, herbicides and fungicides. These chemicals are the most widespread method for pest control; farmers spend approximately $4.1 billion on pesticides every year. However, because pesticides are poisons, they pose a potential risk to humans as well as to the environment. Certain pesticides can enter and “pollute the tissues of virtually every life form on earth, the air, and the lakes and the oceans, the fishes that live in them and the birds that eat the fishes” (Aktar 2009). The insecticide DDT, for example, was found to interfere with the bald eagle’s ability to make strong eggshells. The shells became so thin that they cracked when the eagle attempted to incubate them, thus severely decreasing the population of the bald eagle (and other birds of prey). In addition to pesticides, many farmers also plant their crops with nitrogen, phosphorous and/or potassium based fertilizers in order to foster rapid plant growth. These additional nutrients in the soil typically result in more bountiful harvests and higher yields, but like pesticides, can lead to harmful effects on human health and the environment. Runaway nitrogen can result in “suffocating wildlife in lakes and estuaries, contaminating groundwater, and even warming the globe’s climate” (National Geographic 2013). The effects of nitrogen overuse and runoff can be clearly seen in China’s lakes. More than half of their lakes regularly experience blooms of algae and toxic cyanobacteria. These algal blooms in fact threatened the sailing events before the start of the 2008 Beijing Olympic games! See Figure 3 below. Figure 3. Algae bloom in China’s water threatened the 2008 Beijing Olympic Games. Source: NYSun.com Technological inventions like tractors, ploughs and trucks during the mid 1900s made farming faster and more efficient than in previous years when the primary source of horsepower on farms came from mules or horses. These agricultural machines, however, use fossil fuels to power their engines, which adds CO2 to the atmosphere when burned. With the development of these various farming techniques, came the change in food production in America. Corn is an example of a major crop that has dramatically changed over time, in both the way that it is consumed and grown. Sweet corn is the type that Americans purchase for consumption at the supermarket. Dent corn is the type of corn used to make processed foods and to feed livestock, cattle and poultry; it accounts of 95% of all the corn that is grown in the United States. The United States is now the largest producer of corn in the world. 84 million acres of corn were harvested in the United States in 2011, on over 400,000 farms mostly concentrated in the Midwest. Corn is overproduced primarily because it is a heavily subsidized crop. In the last 15 years, taxpayers paid corn farmers more than $77 billion (Cheney and Ellis, King Corn). Farmers are paid per bushel, so the more corn they grow, the more money they make. As a result, corn can be found in almost all foods that we eat, disguised as high-fructose corn syrup, maltodextrin and other processed ingredients. By analyzing intensive farming techniques, students will learn about the biogeochemical cycles and the impact modern farming has had on these cycles. Pushing students to understand this concept in detail will add significant depth to a concept that is often oversimplified. Students often have difficulty retaining the information found in this portion of the biology curriculum because the content is dense and they often struggle to relate the information to their own background knowledge. Explicit teaching of the biogeochemical cycles can be very dry and boring. Students tend to simply memorize the facts, which are quickly forgotten moments after an assessment. Student learning must be an active process that connects to problems relevant to students’ lives in order for the information to be retained (Chaplin and Manske, 2005).
The objectives of this unit will include the following:
Explicit teaching Drill and practice Real world applications Designing experiments Practice expository writing Group Activity/Think pair share
At Horace Furness High School, classes meet for 55 minutes every day. Science classes have access to a lab room one day a week. Class activities include planting seeds with and without fertilizer to compare growth rates; analyzing food labels; making a “Corn Map” of the United States; visiting stations around the room; modeling the water cycle and calculating a person’s carbon footprint. Going into this unit, students should have sufficient background information on the states of matter, water properties (particularly on acids and bases), characteristics of the biomes, and how energy passes through an ecosystem (trophic levels). They should also have some experience designing and conducting experiments. Lesson One: – Objective: Design and conduct an experiment with plants in order to determine the effects of nitrogen on plant growth – Activities: Lesson Two: – Objective: Explain why corn is the most common ingredient in popular snack foods – Activities: Lesson Three: – Objectives: Describe the different types of corn and its various uses – Activities: Lesson Four: – Objectives: (1) Describe the importance of nitrogen in plants and humans (2) Explain the stages of the nitrogen cycle – Activities: Lesson Five: – Objectives: (1) Describe why and how food is produced in mass quantities (2) Define “intensive farming” – Activities: Lesson Six: – Objectives: (1) Explain the stages of the water cycle (2) Analyze how man-made factors (ex: agriculture) can effect the water cycle – Note: At the beginning of class, collect all the water bottles. These plastic bottles can be used for the water cycle demonstration in this lesson, or for the soil activity in Lesson Seven. – Activities: Lesson Seven: – Objectives: (1) Explain the stages of the water cycle and the carbon cycle (2) Analyze how man-made factors (ex: agriculture) can affect the water cycle and the carbon cycle – Activities: Lesson Eight: – Objectives: (1) Explain the stages of the carbon cycle (2) Analyze how man-made factors affect the carbon cycle – Activities: Lesson Nine: – Objective: Relate sustainable agriculture techniques to the carbon cycle – Activities: Lesson Ten: – Objective: Evaluate the environmental impact of agriculture on the carbon cycle (climate change) – Activities: [The cumulative unit assessment will be the lab report assigned in Lesson Ten, the guidelines of which can be found in the Appendix (see Handout 2: Lab Report Grade Sheet). The Ecology Unit will culminate in a written exam in which students demonstrate their knowledge by answering multiple choice and free response questions. Many of these questions will be pulled directly from a sample high-stakes exam (i.e. Biology Keystone, Biology SAT, ACT Science and/or Science PSSA).]
Student Resources Johnson, George B. Holt Biology. Orlando, Fl.: Holt, Rinehart and Winston, 2004. Print. [This biology textbook provides a good reference and pictures for students.] Schlosser, Eric, and Charles Wilson. Chew on This: Everything You Don’t Want to Know about Fast Food. Boston: Houghton Mifflin, 2006. [This book is a modified version of the book “Fast Food Nation”. It can be used as an extension of the topics covered in this unit. Reading excerpts from the book would be appropriate homework assignments for this unit.] Teacher Resources “7 Billion, National Geographic Magazine.” YouTube. YouTube, n.d. Web. 04 June 2014. <https://www.youtube.com/watch?v=sc4HxPxNrZ0>. [This is a well-made video describing the increasing world human population.] “Activity 4: The Water Cycle.” Learn: Atmospheric Science Explorers. University Corporation for Atmospheric Research, n.d. Web. <https://www.ucar.edu/learn/1_1_2_4t.htm>. [This is one potential water cycle activity.] Aktar, Wasim, Dwaipayan Sengupta, and Ashim Chowdhury. “Impact of Pesticides Use in Agriculture: Their Benefits and Hazards.”Interdisciplinary Toxicology 2.1 (2009): n. pag. Web. [This journal article provides extensive information about the benefits and harms of pesticide use in agriculture.] Associated Press. “China’s Olympic Sailing Venue Beset by Algae Bloom.”New York Sun 26 June 2008: n. pag. Web. [This news article discusses the algae bloom that threatened the sailing event in the 2008 Beijing Olympic games.] Bernhard, Anne. “The Nitrogen Cycle: Processes, Players, and Human Impact.”Nature.com. Nature Publishing Group, 2012. Web. 25 Mar. 2014. [This website provides a reference about the nitrogen cycle.] “Carbon Nitrogen Phosphorous Cycle Worksheet.” N.p., n.d. Web. <http://www.biologyjunction.com/Cycles_worksheet.pdf>. [This worksheet reviews the carbon and nitrogen cycle.] Carnell, Ronald L., and Rebecca M. Price. Global Climate Change: What Does It Look Like? (n.d.): n. pag. National Center for Case Study Teaching in Science, 6 Jan. [This is a good case study about climate change and its implications.] Chaplin, Susan B. “A Theme-Based Approach to Teaching Non-Majors Biology.” NSTA.org. N.p., Sept. 2005. Web. [This journal article describes another approach to making science learning more relevant to students.] “Corn Derived Ingredients.” N.p., n.d. Web. <http://pov-tc.pbs.org/pov/pdf/foodinc/ foodinc_corn_derived_handout.pdf>. [This PDF lists some of the ingredients derived from corn.] D’Alessandro, Liane. “The Water Cycle.” Haverford College, n.d. Web. <http://www.haverford.edu/educ/knight-booklet/watercycle.htm>. [This is a water cycle activity.] Deforestation. National Geographic, n.d. Web. <http://environment.national geographic.com/environment/global-warming/deforestation-overview/#>. [This website provides good background information about deforestation.] “Earth’s Water: A Drop in Your Cup.” California Academy of Sciences. N.p., n.d. Web. <http://www.calacademy.org/teachers/resources/lessons/earths-water-a-drop-in- your-cup/>. [This activity demonstrates how much water on Earth is available for human use.] Eat Low Carbon. Bon Appetit Management Company, n.d. Web. <www.eatlowcarbon.org>. [This is an interactive quiz that has participants compare foods based on the carbon content in them.] “Food Carbon Emissions Calculator by CleanMetrics.” CleanMetrics, 2011. Web. 05 June 2014. <http://www.foodemissions.com/foodemissions/Calculator.aspx>. [This website allows viewers to calculate the total amount of carbon dioxide certain foods emit during production and transportation.] Food, Inc. Dir. Robert Kenner. 2008. [This documentary film examines corporate farming of animals in the United States.] Hydrologic Cycle. West University University, n.d. Web. <http://online.wvu.edu/Faculty /demo/Module_2/hydrologic.html>. [This website clearly describes the components of the water cycle.] Instructional Strategies Online. Saskatoon Public Schools, n.d. Web. <http://olc. spsd.sk.ca/De/PD/instr/strats/explicitteaching/index.html>. [This website is a good resource about different instructional strategies.] Intensive Agriculture. Dennis O’Neil, 2006. Web. <http://anthro.palomar.edu/ subsistence/sub_5.htm>. [This website provides good background information about intensive agriculture.] King Corn. Dir. Ian Cheney and Curtis Ellis. 2007. [A humorous and informational documentary that follows two friends out to Iowa to grow an acre of corn. In the process, they learn about how corn is grown in America, how it is processed and the effects of its overproduction. This video can be viewed for free on www.hulu.com] Landeen, Melissa. “The Carbon Cycle or The Circle of Life.” YouTube. YouTube, 29 May 2012. Web. 05 June 2014. <https://www.youtube.com/ watch?v=4vJ_1ojjlxw>. [This video describes the carbon cycle.] Pollan, Michael. The Omnivore’s Dilemma: A Natural History of Four Meals. New York: Penguin, 2006. [This book provides great background knowledge about modern food production, especially that of corn and meat.] Raven, Peter H., and George B. Johnson. Biology. 10th ed. New York: McGraw Hill, 2014. Print. [This AP biology textbook is a great resource on all biology topics.] “The Water Cycle.” Community Collaborative Rain, Hail and Snow Network, n.d. Web. 05 June 2014. <https://www.youtube.com/watch?v=ZzY5-NZSzVw>. [This video describes the water cycle.] “Water, Carbon and Nitrogen Cycle Worksheet/Color Sheet.” N.p., n.d. Web. <http://www.biologyjunction.com/Biogeochemical_Cycles.pdf>. [This link leads to a worksheet about the water, carbon and nitrogen cycles.]
Handout 1: Corn Production in the United States This handout is adapted from “ http://www.educationworld.com/a_lesson/03/lp324-01.shtml” Each of the 21 U.S. states listed on the chart below produced at least 50,000,000 bushels of corn in 2001. Additional Corn Activity #1: Seed Dissection. 5 pts. iii) what do you think the inside of the seed is? Additional Corn Activity #2: Making Oobleck with a Partner. 5 pts. Procedure: Questions: Handout 2: Lab Report Grade Sheet Style: Neat, legible handwriting __________/1 Each section of lab report titled _____/2 Title: Present _________/1 Group Members: Present with first and last names __________/1 Introduction: 5 Background facts present_________/3 Background facts are relevant to the experiment and accurate ______/3 Hypothesis present, well-stated and testable ______/2 Purpose _____/2 Independent/Dependent/controlled variables defined _______/3 Materials: Listed and complete_________/2 Procedure: Complete and easy to follow _________/2 Data: Organized __________/2 Complete __________/1 Results: X-Y graph is plotted correctly, according to data table __________/2 All axes are labeled, key is provided if necessary __________/2 One sentence description present and clear __________/1 Title of graph present __________/1 Conclusion: Identifies support for or against hypothesis __________/2 Uses information from lab to support answer __________/1 Discussion of results (what do your results mean? why did you get the results you did?) __________/3 Identifies at least two sources of possible error __________/1 Proposes a follow-up experiment __________/2 Additional info (+2) __________ Grammar and Spelling: More than 5 misspelled words (-2) More than 5 grammatical errors (-2) Total: ________________/40 = ________% = ____________
State name
Corn Production (in bushels)
Production (rounded to nearest 100,000,000)
Number of Corn Kernels
Colorado
149,000,000
100,000,000
1 kernel
Illinois
1,629,200,000
Indiana
884,500,000
Iowa
1,664,400,000
Kansas
387,400,000
Michigan
200,000,000
Minnesota
806,000,000
Nebraska
1,139,300,000
Pennsylvania
97,000,000
Ohio
437,500,000
Wisconsin
330,200,000
Texas
167,600000
South Dakota
370,600,000
This unit aligns to the Pennsylvania Academic standards for Science and Technology and Engineering Education, as well as the Pennsylvania Common Core Standards in Reading and Writing for Science and Technical Subjects. 4.2.10.B.1: Explain how human practice affect the quality of the water and soil. 4.6.10.B.1: Describe an element cycle and its role in an ecosystem. 4.6.10.B.2: Explain the consequences of interrupting natural cycles. 4.6.10.C.3: Analyze consequences of interrupting natural cycles.