
This unit is based on the Teacher Institute of Philadelphia’s seminar entitled, “Environmental Humanities, from the Tidal Schuylkill River. What is a river? Who does it belong to? How do we get to hear it’s stories? What does it mean to be a forgotten place? This seminar, through the use of maps, spoken word, graphs, poetry, and place-based learning, opened the doors to the topic of environmental humanities and how it connects to all other academic disciplines. What does it mean to educate for sustainability? Our students need to be thinking about their futures and they need to be aware that they play an important role in the problem as well as the solution.
Relevant and authentic learning opportunities are often not present in classrooms. There is no question, scientifically that the average surface temperature has risen over the last 150 years and the main cause is increased carbon dioxide caused by human activities. For some reason, this is still considered a debatable topic in education and often absent from the classroom. Students are not given the opportunity to learn about climate science because some still feel it is connected to politics. This led me to my unit. I knew I wanted to create a math unit based on climate science and how it can impact Philadelphia. This unit will explore how the people of Philadelphia have already been impacted by the changes in the environment. The students will look at various sources of data comparing the increase in global temperature with the increase in sea level with the diminished coast lines. They will explore how Philadelphia’s coastlines have changed and how humans and our cultures shape our environment. The students will look at the predictions of Philadelphia’s coastlines and the neighborhoods near the coast and analyze what will happen if change does not happen. How does this impact their lives?
Sustainability is the ability of living things to exist over time. This unit will hopefully provide students with tools to see the changes that need to happen and feel equipped to make a change. The unit will close with the students writing to state legislators with the support of their data and analysis. I want to educate my students for their futures and so that they are prepared to be active members of their futures. We need to prepare our students to be problem solvers, critical thinkers, and to be able to read, write, and see the world around them.
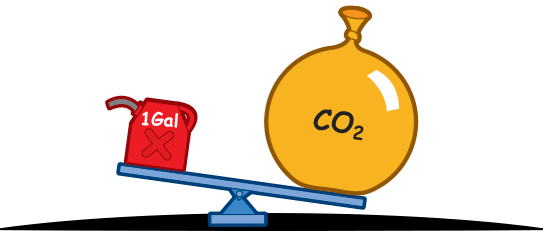
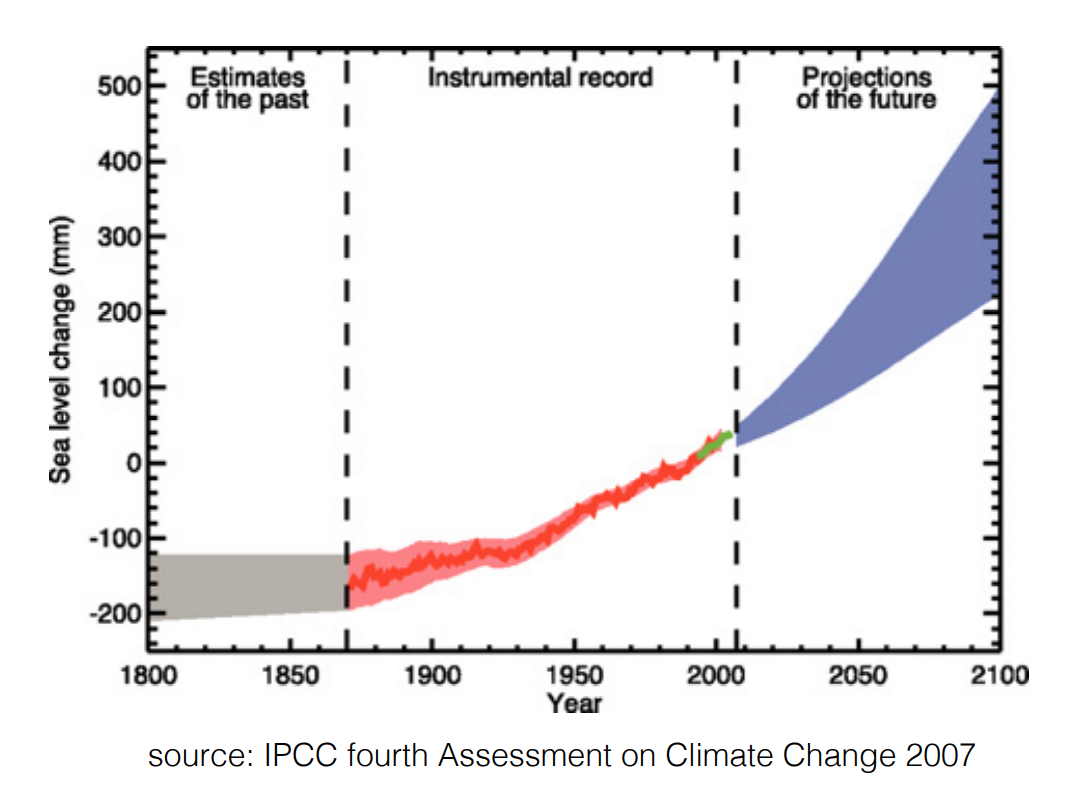
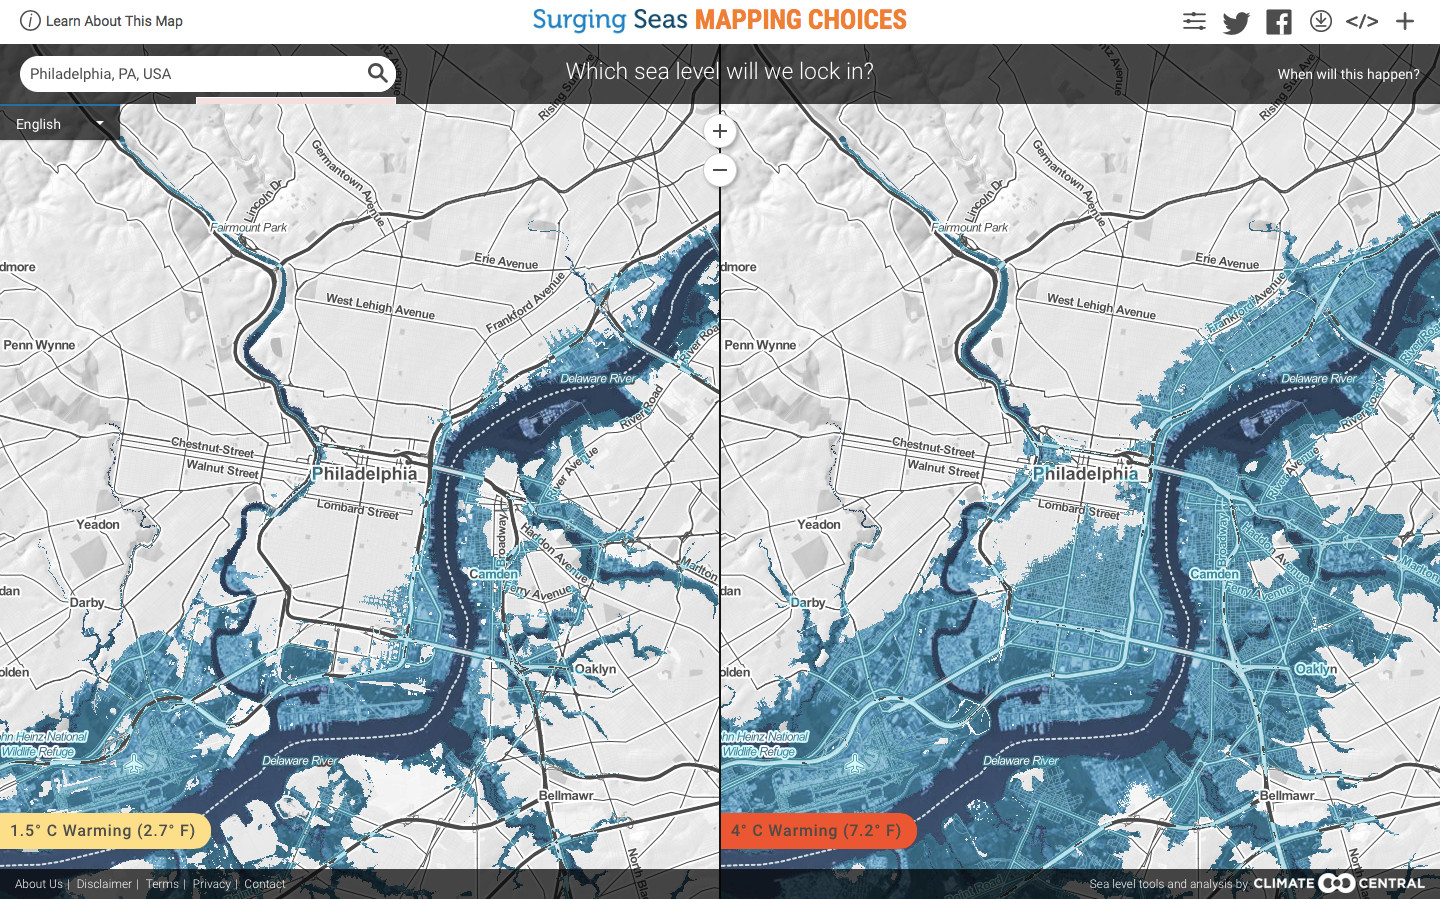
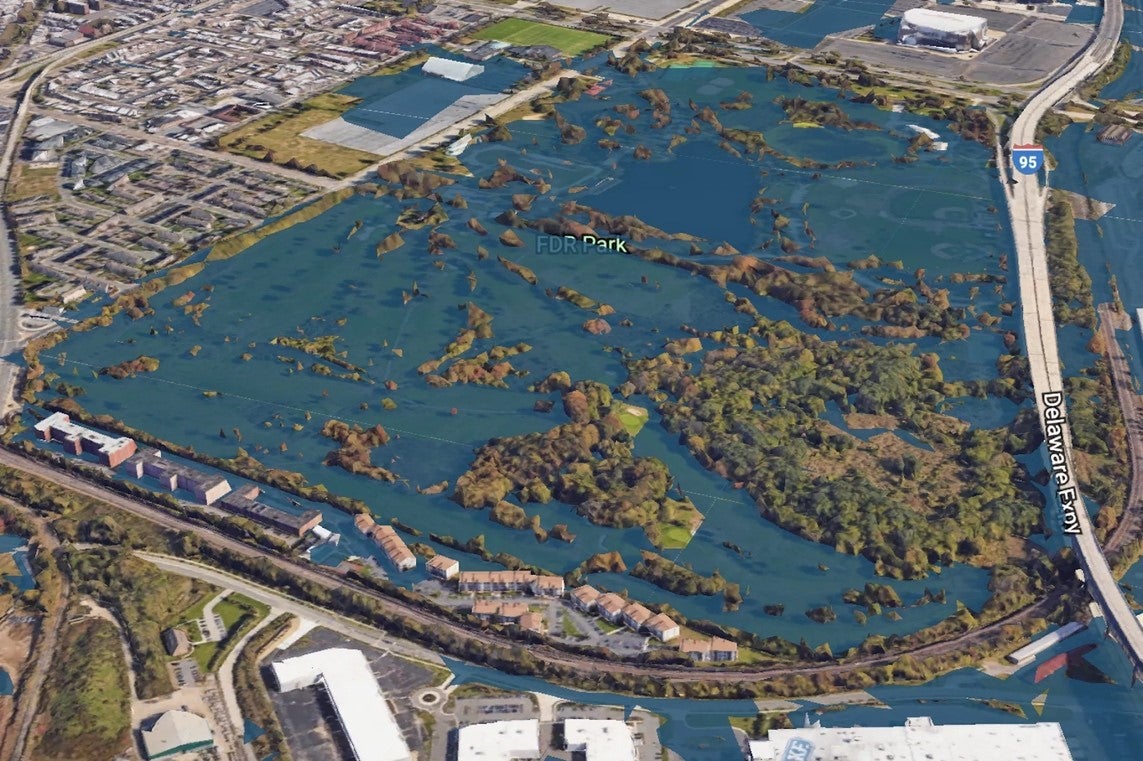
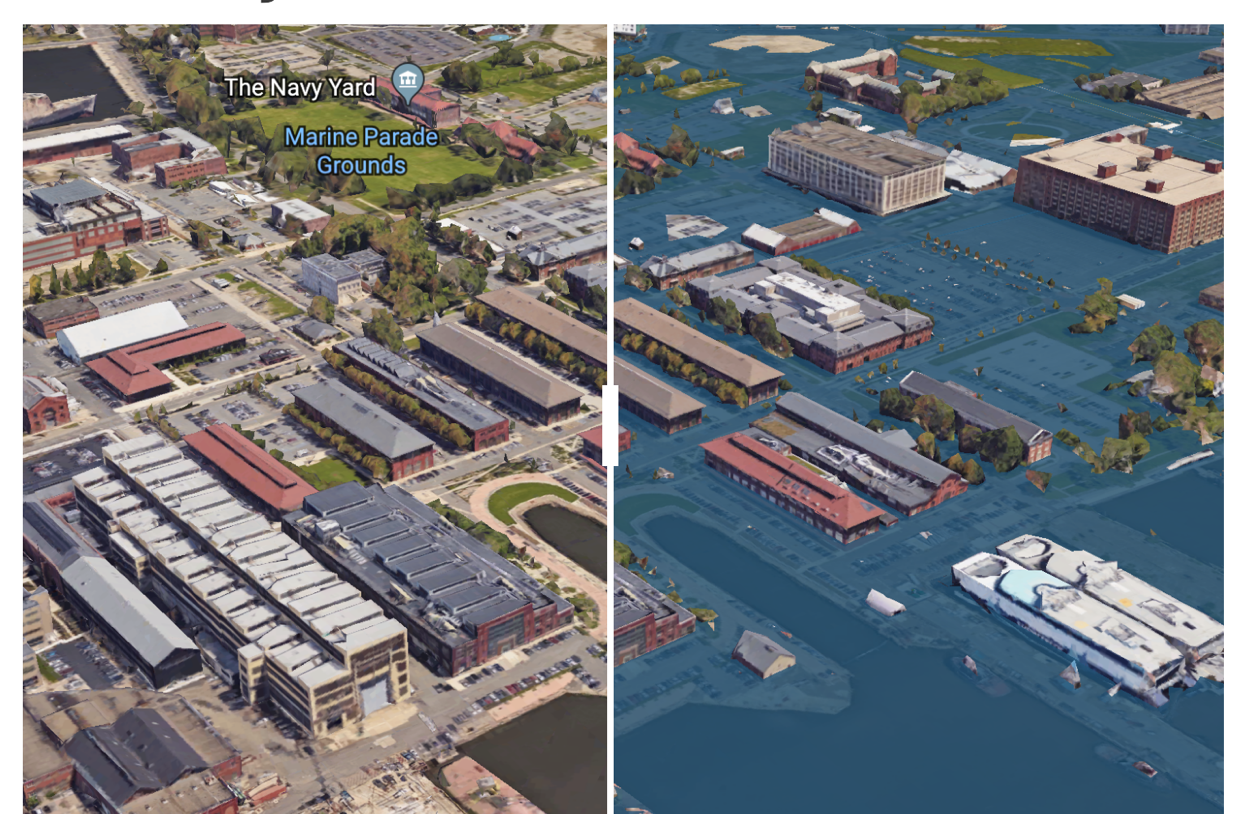
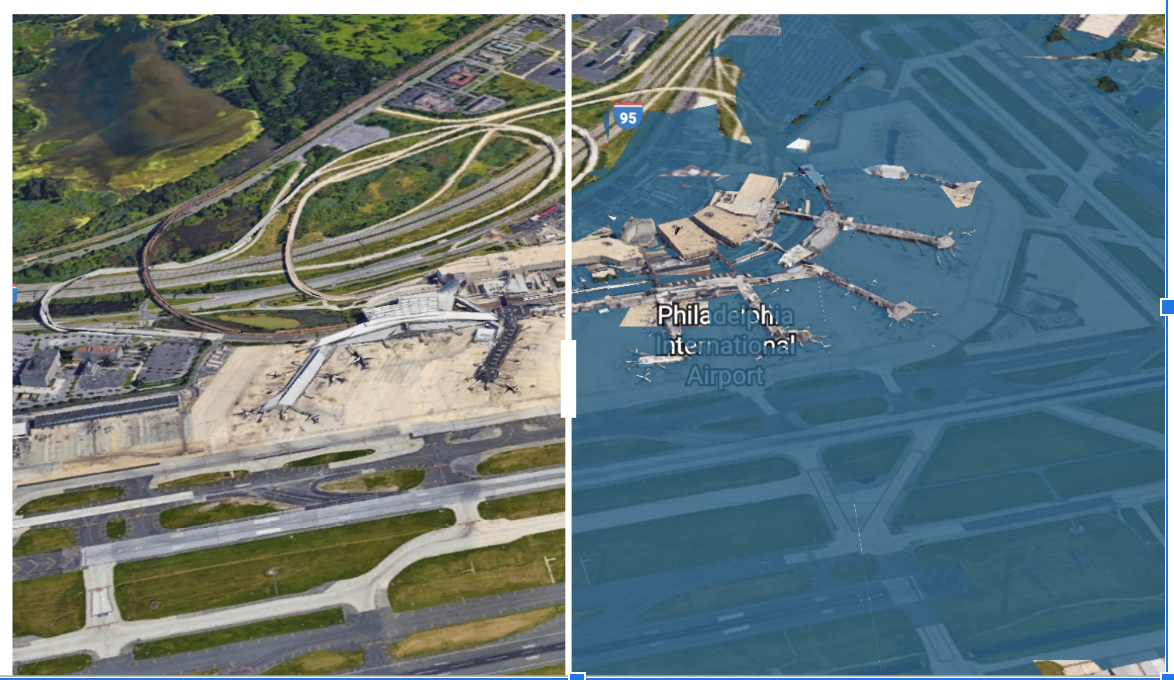
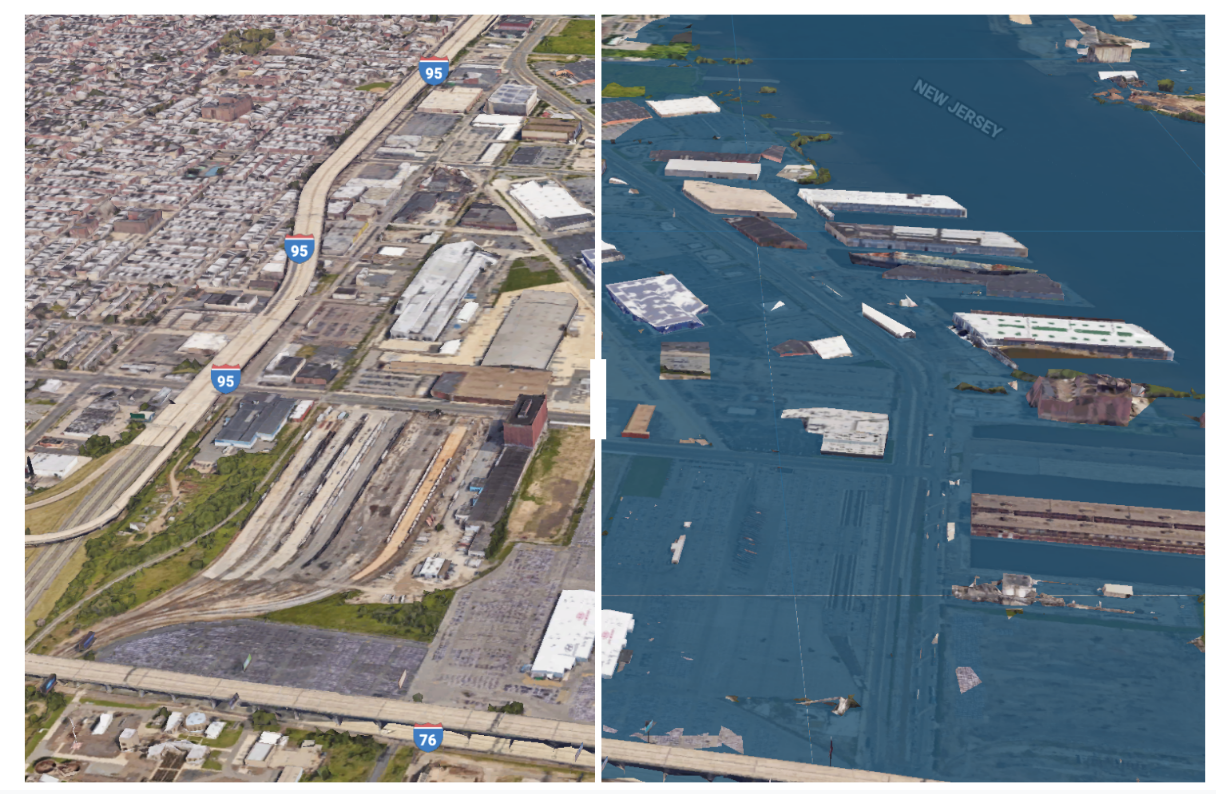
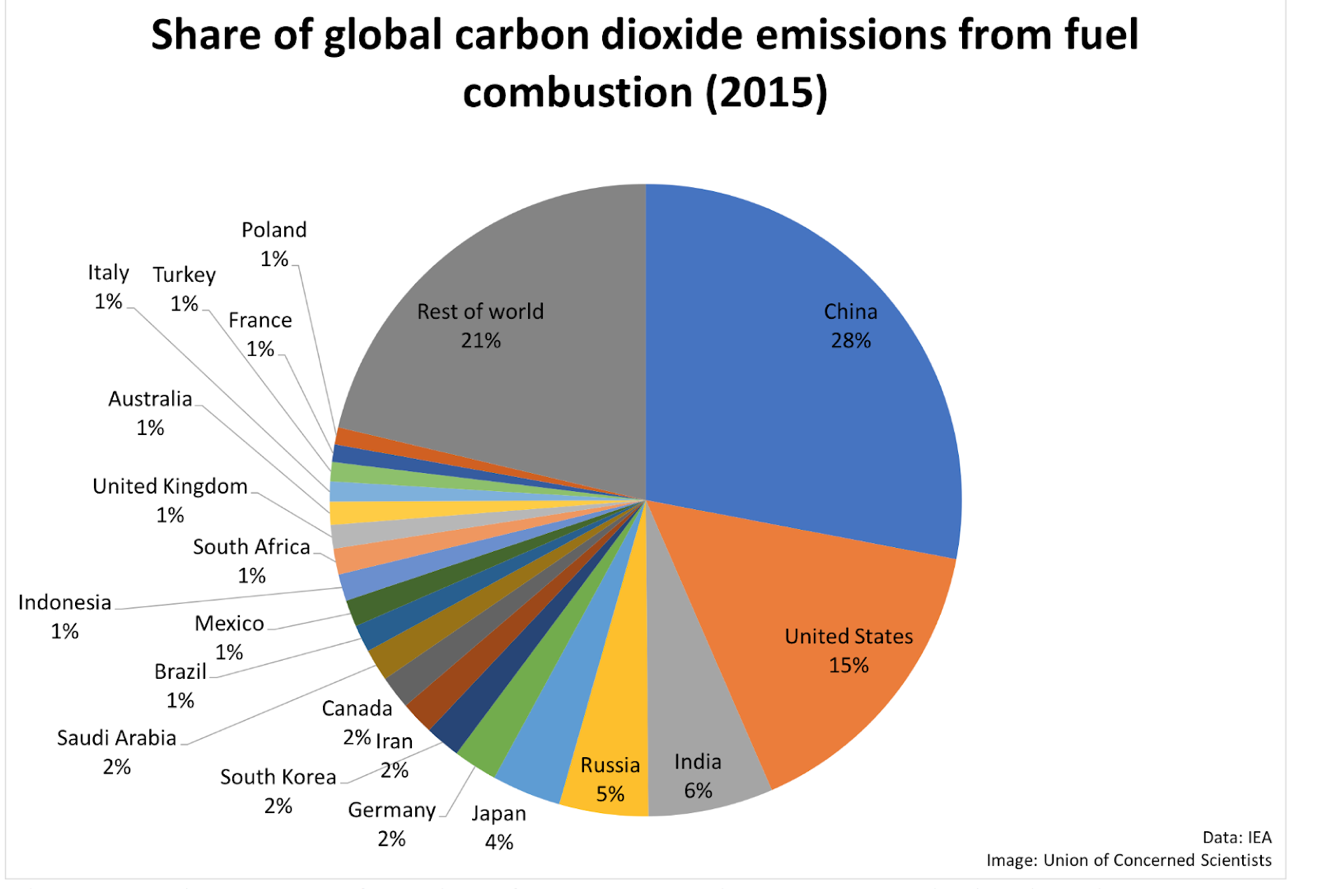
I teach tenth graders in an urban environment in the Mount Airy neighborhood of Philadelphia. My students are completely detached from what they learn at school. They complete things in isolation, or for a grade, but they are not thinking about the bigger picture of their learning. My students need a wakeup call. The learning that my students are doing needs to have a purpose. I need to be educating them for their future, at a time when our planetary future and diverse local futures are uncertain (and so hard to predict.) Why do we teach students math? Math education needs to provide students with the skills to see problems, and the skills to be the change to solve the problems that exist. In my 9th and 10th grade Integrated Algebra 1 and Algebra 2 class students will complete an interdisciplinary study of math and science through the topic environmental humanities and data visualization. The students will explore how Philadelphia’s littoral zones, its coastlines, have changed and how humans and our cultures shape our environment more generally as well as how the environment and our cultures have shaped the lives of humans. What does the Schuylkill River represent for Philadelphia? Environmentally and biologically what is happening to the coastline of the river? Students will have the opportunity to participate in placed based learning by engaging with the river first hand experienced and through data analysis. What connections do my students feel to the river? What knowledge do they have of it as a place? The students will be looking at data comparing the increase in global temperature with the increase in sea levels and the diminished coast lines and addressing if a connection exists, and if this is true, are we going to lose part of Center City Philadelphia, what will become of the Philadelphia International Airport? The students will also be learning about a carbon footprint and how that impacts these changes. The students will be exploring how the American carbon footprint compares to that of a global citizen. Ultimately the question that will be put to the students, what can they do as a globally minded citizen, to improve their own carbon footprint and how can they take action beyond their own footprint? How can they teach others in the city of Philadelphia how to live a life with less of a carbon footprint? The students will work collectively to write state legislators with the support of their data and what they have learned through the unit. The overarching goals of the unit will be: responsible consumption, climate action, and sustainable cities. The rationale for this unit is in research about teaching for sustainability in math classrooms. My research will explore educating for sustainability and what the goals of sustainable education are. I will further extend the research is by looking at how it can be incorporated into the math classroom. I will research how others have incorporated sustainability into high school math classrooms, and look at the philosophy behind incorporating sustainability into the classroom. Why should we educate for sustainability in the math classroom? Students need to see the relevance and power that math has. How do I as an educator for sustainability instruct them to help preserve it and work to make things better for the generations to come. How do I teach my students to find value in their education and make meaning out of what they are learning? This unit fits into an Algebra 1 or in an Algebra 2 curriculum and the common core standards under the unit of Statistics combined with certain topics of Functions: Interpreting Categorical & Quantitative Data, Making Inferences & Justifying Conclusions, and Summarize, Represent, and Interpret Data on Two Categorical and Quantitative Variables, Analyze Functions using Different Representations, and Interpreting Functions that Arise in Applications in Terms of the Context. The students will be asked to analyze, summarize, interpret, and represent data and use that to make data informed recommendations to local legislators come up with suggestions to propose solutions to environmental problems. The Standards for Mathematical Practice exemplify the habits and behaviors of mathematicians. Standards for Mathematical Practices Math Standards: Educating for Sustainability Standards: Environmental Science – Next Gen Science Standards In the typical math classroom learning is very passive. Math instruction focuses on arbitrary rules and procedures rather than on ways that math connects and creates. Math class needs to provide learning opportunities for the students that requires them to ask questions and find answers that have meaning and personal relevance. Learning in the math classroom must provide authentic learning experiences for students to allow them to look for patterns, model a situation, and make sense of data in order to problem solve. In their study of growth mindset, Brock and Hundley (2016) urge, “We should be inspiring in our students curiosity about the world, not about how many points they need to get an A.” To do so, we need to find a way to present authentic learning opportunities. These, as they also note, tend to generate as many questions as they do answers. Effective math instruction utilizes student interest and allows the students to make personal connections and see themselves or their lives in what they are learning. Place-based math learning experiences is one way to encourage relevance and personal meaning. The Schuylkill River is central to the city where all of the students of Philadelphia live. It is part of their lives. Math instruction should utilize the content that is relevant to the lives of the students that you teach. As math teachers we want students to care more about what and why they are learning as opposed to being only focused on the grade that they will earn for the assignment. Sustainable Education is an education that is preparing students for their futures by equipping them with the tools to problem solve the inequalities of society. We are educating for a sustainable future. There needs to be opportunities to learn about sustainability and how as individuals we can make a difference in our larger communities at a variety of scales. But sustainable solutions depend very much on local as well as individual histories and cultures. These interactions between sustainability, nature, and culture are sometimes called the environmental humanities, and this unit draws from this new academic field. Learning in the classroom can start with a discussion of the issues that are present in their communities, their school, and their families. From this discussion comes a collection of topics in which data can be collected. With the data, the students can begin to calculate and analyze. They can make conclusions and justifications. They can learn to use math to defend their ideas. With their conclusions can be proposals for change, reinforcing that math is a tool for change. Focus 1: Number Sense Focus 2: Visualizing & Summarizing Data Focus 3: Quantitative Literacy Focus 4: Functions & Algebra Sea level rise is the increasing of the average global sea level. “Sea level is not constant everywhere. This is because it can be affected by ocean currents and natural cycles, such as the Pacific Decadal Oscillation, or PDO, a 20- to 30-year cyclical fluctuation in the Pacific Ocean’s surface temperature. Because of the PDO, right now the Eastern Pacific has higher sea levels than usual, while the Western Pacific has lower sea levels than usual. However, the global average of 3 millimeters of sea level rise per year is increasing and the rate that it’s increasing is speeding up.” (NASA, 2019) A carbon footprint is the total amount of greenhouse gases produced to directly and indirectly support human activities, usually expressed in equivalent tons of carbon dioxide (CO2). (timeforchange.org) A carbon footprint simply is the amount of carbon dioxide that is released into the air because of one’s energy needs. The choices that an individual makes can impact the amount of carbon dioxide that is released. Choosing to walk or bike somewhere instead of getting in a Lyft or an Uber prevents carbon dioxide from being released into the air. “Even a 2-mile car trip puts 2 pounds of CO2 into the atmosphere.” (NASA, 2019) One gallon of gas = 20 pounds of CO2! If we were to extend this ration, burning 6.3 pounds of gasoline produces 20 pounds of carbon dioxide. Most of the weight of carbon dioxide (CO2) comes from the two oxygen atoms (the O2). Gasoline molecules are made of carbon and hydrogen atoms all bound together. When gasoline burns, the carbon and the hydrogen in the gas molecules separate. Two hydrogen atoms combine with one oxygen atom to form H2O, or water. Each carbon atom in the gasoline combines with two oxygen atoms already in the air. This forms CO2. (NASA, 2019) Relationship between global sea level and global average temperature Intergovernmental Panel Climate Change is the United Nations body for assessing the science related to climate change. The IPCC was created to provide regular scientific assessments on climate change and potential future risks. In 2018 the IPCC put out a special report about the impacts of global warming above 1.5°C. These are a few key points from the special report. Climate Central from NOAA, the National Oceanic and Atmospheric Administration, provides information on sea level rise. Their goal is to be able to provide information about coastal flood risk to different local and global regions both in the present and the future. The map below shows two possible predictions for the city of Philadelphia, and what Philadelphia would look like based on the different levels of sea level rise. Climate Central has partnered with Google Earth. Using Google Earth, you can get the Climate Central add on and you can search different cities and then scroll to different parts of the cities. Below are visualizations from Google Earth Data about what Philadelphia could look like in the year 2100 if we continue as a species – globally, nationally, and regionally, across public and private sectors – to take no meaningful action to reduce our carbon consumption. FDR Park in the year 2100 FDR Park 2019 FDR Park 2100 The Navy Yard 2019 The Navy Yard 2100 PHL International Airport 2019 PHL International Airport 2100 Philadelphia near Columbus Blvd 2019 S. Philadelphia near Columbus Blvd 2100 But what is Sustainable Education? “It is a whole system of inquiry that combines current best practices of teaching and learning with the content, core competencies, and habits of mind required for students to actively participate in creating a sustainable future” (Cloud, 2014, p.1). It can be defined as a transformative learning process that equips students, teachers, schools, and informal educators with the knowledge and ways of thinking that society needs to achieve economic prosperity and responsible citizenship while restoring the health of the living systems upon which our lives depend”(Cloud, 2014, p.1) Sustainability for some is a contested word. Some argue that the term is too vague and that it is used too often so that it has lost meaning. There are those that critique that idea of sustainability as enabling more of the same and they argue that we do not want to sustain the society that we currently live in and have today. In “In Catastrophic Times” Isabelle Stengers, critiques the idea of sustainability. Her critique discusses what is it that we hope to sustain? Humans are not trying to sustain nature as it exists. Humans are trying to sustain nature as we humans prefer it. Humans are looking to preserve the resources needed for human consumption, whether that means energy consumption or aesthetic consumption. In one sense, humans preserve nature for industry. Stengers writes how sustainability has become a form of capitalism where people can seek sustainable employment. In a society where capitalism still reigns true sustainability will be a challenge. “The question of sustainability is much deeper than environmentalism or ‘greening,’…Roper studies and Gallup polls indicate that as many as 70 percent of school-age youth feel hopeless about the future and disempowered in their daily lives…We can choose a different destination. We can learn. We can trump the habits that reside in the hardwiring of our brains that got us into this situation in the first place, and we can exercise our free will to move toward a healthy and sustainable future.” (Cloud, 2010, p.169) This is what this unit hopes to accomplish when it defines sustainability and sustainable education. Sustainable Education aims to equip students with the skills and knowledge–as well as the mindsets–that prepare them to be able to create and contribute to a future more just and healthy world. “Educators for sustainability work to develop in young people and adults the knowledge, skills, attitudes, and enduring understandings required to individually and collectively contribute to a healthy and sustainable future” (Cloud, 2010, p.170). Students need to leave school prepared for their futures; they need to be equipped to problem solve, communicate, productively struggle, collaborate, demonstrate environmental literacy, numeric literacy, financial literacy, and be able to read, write, and see the world that exists around them. The curriculum in schools needs to provide these skills to students. “Most people in the United States do not have a shared understanding of the knowledge, skills, and habits of mind required to make the shift toward a sustainable future. If they did, they would have learned them in school, because the foundations of our knowledge, skills, and habits of mind are cultivated in our schools. We have to learn how to live well in our places without undermining their ability to sustain us over time.” (Cloud, 2010, p.170) Cloud continues, “we have disconnected so drastically from our sense of place that ironically we poison our water, our air, and our food while at the same time we work hard to secure a healthy and meaningful future for our children. Education for sustainability helps us create optimistic visions and develops in us the capacity for actions that are consistent with those visions.” By definition formally sustainable development is defined as “the ability to meet the needs of the present without compromising the ability of future generations to meet their own needs.”(Brundtland, 1987, p.16) Learning to live sustainably on Earth is going to require enormous advances in our understanding of the natural world and our relationship with it. To acquire that understanding, progress in the mathematical sciences is essential. We need humans to have a better understanding of the mathematical sciences so that humans are better equipped to solve economic, business, technological, scientific, and health and problems. The human population is on its way toward ten billion people. All of these people will need food, clean water, housing and energy. To stay within the planet’s carrying capacity, we are going to have to be extraordinarily clever about how we use the Earth’s resources. Today, Mathematics plays a big role in sustainable development in all of its aspects: social, environmental, and economic. Many developmental challenges could be solved if it is possible to get mathematical models that could describe them. Educating for sustainability gives education a purpose. When the students ask ‘why are we learning this’, or ‘when will I ever need this,’ there is a clear and direct answer that is directly related to their own life and their own future. It is an opportunity to empower the students and to teach them to reconnect with with their sense of place. Education for Sustainability Standards & Performance Indicators (Cloud Institute for Sustainability Education) This unit will more specifically incorporate educating for sustainability into the math classroom. “Integrating the environment into the discourse of the math classroom signals the possibility of a more genuine mathematics education – one that is not so much about acquiring certain competencies but about noticing the world different, seeing proportional reasoning in multiple contexts, making connections, and moving to ethical action as a result of increased awareness.” (Renert, 2011, p.21) Number sense needs to part of the mathematics curriculum. Throughout many years of teaching so often my students are focused on the steps to get to an answer, that they do not even stop to think if their answer makes sense. Many times, if they tried to understand the situation and make sense of the numbers, they might rethink their answer. In our math classrooms students need to be taught to feel the numbers. Two examples are detailed below. The rate at which animals convert grain into protein varies considerably. Cows are much less efficient than poultry, pork, or herbivore species. In order to make sense of this students need to understand proportional reasoning. In his study of Sustainable Math Education, Renert (2011), writes “with cattle in a feedlot it takes roughly 7 kilograms of grain to produce a 1 kilogram gain in live weight. For pork it takes over 3 kilograms, for poultry, just over 2 kilograms, and for herbivorous species of farmed fish, less than 2” (Renert, 2011, p.21). When a student learns that taking a bite of beef stresses the environment 2.3 times as much, this might change the way they think about eating. There is now context to a very abstract topic that the student could not conceptualize. The student may simply just be more aware that food impacts the environment differently and the foods that they choose to eat actively impacts the environment. They can make the connection that changing their diet can have an impact. Instead of talking about the efficiency of the animals you could talk about the amount of carbon dioxide that is released into the atmosphere by eating a portion of a certain food. The students can compare and contrast, they can discuss their own food choices, and how their food choices impact the carbon dioxide being released into the atmosphere. The students need to learn to see themselves as part of the world, and learn to see the world that is around them. If they inform more people about this, this is how change can begin to happen. The focus of instruction can be based about making sure that we as living things continue to exist, and the world that we live in continues to exist. Math is a tool for all individuals to feel empowered. Math has often been a subject where labels are placed on individuals and it divides people by their skin color or their socioeconomic class. Teaching for equity is a way to teach so that the students feel empowered and they see the changes that need to happen and they feel equipped to make a change. “Humans emit 29 trillion (2.9 x 10¹³) kilograms of carbon to the atmosphere each year. Like most other numbers that describe ecological quantities, it is a large number. But how much carbon is this? We cannot readily imagine this amount, let alone have a felt bodily sensation of it….When it comes to large numbers, our number sense is almost entirely divorced from any quantity sense. Humans’ ability to count – that is use numbers as symbolic representations of quantities – provides us with a powerful mechanism for storing, recalling, and manipulating cultural information. But human’s inability to feel large numbers is very problematic in our feelings with ecology and the environment. If we do not feel numbers, then our emotional access to the physical phenomena they represent is much diminished.” (Renert, 2011, p.21) Students need to have a sense of the numbers, so that they can comprehend the situations that are happening around them. Teachers need to give students a visual situation that they can connect with. They need to be using visuals in the classroom to help the students visualize the numbers. An example “imagine you are driving in your car and every mile you drive you throw a pound of trash out your window. And everyone else on the freeway in their cars and trucks is doing the exact same thing, and people driving Hummers are throwing two bags out at a time – one out the driver-side window and one out the passenger-side window. How would you feel? Not so good. Well, that is exactly what we are doing; you just can’t see it. Only what we are throwing out is a pound of CO₂ – that’s what goes into the atmosphere on average, every mile we drive. (Friedman, 2008) This approach is a visual approach. It is creating a representation for the students that they can comprehend and make sense of and connect with and using it to create a sense of scale and to create the numeracy skills necessary in the students to problem solve the actual situation. Mathematics instruction should be focused on teaching students to be mathematically literate. Being able to read, write, and make sense of the world around them. Being able to read the world through math is being able to recognize the inequities that exist and the social, political, and environmental problems in the local community and within society. Helping the students to develop mathematical power is to help students to understand the complexity of these problems and how math can provide solutions to these problems. By coming up with solutions students are able to recognize the power of math and change the way that they view math to see math as a tool for change. Data visualization focuses on the art of creating a graphic representation. Knowledge about data visualization allows students to create more effective visuals. The main topics of data visualization present in this unit are:Problem Statement
Unit Standards
Content Objectives
Background Content For the Unit
Mathematics Background
Environmental Science Background

Sustainable Education Background
Teaching Math for Sustainability
Data Visualization
Productive Struggle Tasks: The goal of a productive struggle task if to have a task that all students can access regardless of ability. There are many different ways to approach the given ask and the focus is on the process Do Nows: Utilizing Would You Rather Math; What do you notice, What do you wonder; Which Doesn’t Belong; Estimation 180; What Comes next; and Number Talks? Each of these prompts require the students to justify their answer or thought pattern. The focus here is getting students reading, writing, and speaking in math class. Good mathematical processes incorporate being able to defend and justify. Guided Notes: Teacher will present some notes to students with guided examples where the teacher and student work through examples and definitions together Student Driven Tasks: Teacher will serve as the facilitator and students will complete various prompts leading them through different tasks and activities. At the end of the task there will be a whole group share out to synthesize conclusions and concepts Investigations: Students will explore data analysis through the use of locally relevant data Reflection: Throughout the unit the students are expected to reflect on a daily basis. Their reflection could include acknowledging what they learned that day, what they worked on, what they are struggling with, any questions they have, or just give a general insight into their inner thoughts for the day. Collecting Real Data: Students will utilize the internet to collect data as well as field trips to the Schuylkill River. Their internet data will focus on sea level levels, global temperatures, and size of Philadelphia coastline. Their field data will be focused around their observations about the Schuylkill River and it’s surroundings as well as the connections that they make or feel while being present at the river. I want the students to be able to write what they see, hear, smell. I want the Schuylkill river in the eyes of my students. Making Graphs from Data: Students will create graphs both by hand and on computers. They will be making line graphs, scatter plots, quadratic functions, exponential functions Analyzing Real Data: Students will be analyzing the data that has been collected to try and fit it to a mathematical model Two examples of What do you notice? What do you wonder? Rising sea level is a threat to people that live near the ocean Which doesn’t belong? Justify your answer. Do Now 2: Would you rather? Justify your answer. 1. Ask the students what they already know about sea level rise? 2. Create a list of what they know, what they want to know, and what information they question or they would list as a misconception they’ve heard. These lists will be modified throughout this lesson. 3. Explain that sea level rise is one climate change impact. Ask students why is the issue of climate change so prevalent in the news? 4. Assign students to review and share with the class an article or video on climate change; specifically sea level rise if possible. (Help students to define what is a trusted or credible source and to think about whether sea level rise will impact them individually.) 5. Look at and update the established lists from the previous session based upon the student shared articles. 6. Have students view Melting Ice, Rising Seas NASA video: http://pmm.nasa.gov/education/videos/melting-ice-rising-seas 7. Discuss what we know and what is still challenging for scientists studying sea level rise. Have students discuss how they think that these questions might be answered. What evidence can we use to see potential and current changes in sea level rise? King tides are the very highest tides that occur at each place. They: • occur naturally and regularly • are predictable and expected • are not an everyday occurrence During extreme high tide events, we can get an idea of what a permanent rise in sea level might look like in our communities in the future. Have students in small groups review the previously captured images of king tides from the list found in the Photo Links section or from other sources, and discuss the following questions in preparation to share their observations with the rest of the group. Student questions: 1. What risks do you see from increased tidal levels? 2. How would you categorize the impact of the tide shown? (it may affect more than one area) a. effects public recreation and access b. effects coastal habitats c. effects coastal agriculture d. effects cultural resources e. effects coastal development f. effects groundwater aquifers – freshwater sources 3. Identify where and when the photo was taken and what the tide height was on that date. Have students report out to the group their findings. • Why do they think that there are limited photos for each of the areas? • Why would people want to take photos and contribute them to the project? Discuss how scientists might use this array of photos including: 1. Document current flood risk in coastal areas 2. Visualize the impacts of future sea level rise in their community 3. Ground-truth and validate climate change models by comparing model predictions with the high-tide reality 4. Serve as a living record of change for future generations See King Tides Initiative: http://california.kingtides.net/how-are-king-tides-photos-used/ How can we forecast sea level rise for the future? The steady rise in sea levels has been attributed to both a warming expansion of the oceans and contributions from melting glaciers and land-based ice sheets. Climate modeling combined with direct observations from tidal gauges and satellites suggest sea level rise will continue well into the future with significant implications for California’s coastal communities, but also for our local coastal communities here in Philadelphia. The predictions are predicting that we could lose the Philadelphia Airport and part of Delaware. Satellites provide a measure of the sea surface height. To gain an understanding of how satellites have built our knowledge watch the Sea Level Viewer Overview at: http://climate.nasa.gov/interactives/sea_level_viewer Some environments will be squeezed out or eroded with sea level rise; other environments and populations will need to retreat from the coast to survive both economically and ecologically. Determining how far to retreat to better ensure long-term success is difficult to determine without modeling. Scientists use models to understand the universe. A model is a physical or mathematical representation that helps to explain a phenomena that cannot be directly observed due to scale or time. Models are critical to scientists being able to communicate their work. They serve as simplified illustrations and enable predictions of future conditions. Scientists use current and past data in testing their models to see if the model works with the available data; they are then able to predict what is likely to happen. Sometimes there are several models for the same question, so that scientists can test their ideas. Inaccuracy in a model sometimes results from not having enough data. Climate models are often computerized and need to be continually tested and revised as we gain new data, thus continuing to refine our knowledge about climate. Together with the class look at sea level predictions found here http://coast.noaa.gov/digitalcoast/tools/slr, and discuss the following questions: • What is expected to happen in your larger community? • Which areas or surrounding areas are especially vulnerable? • How will sea level rise affect recreation, infrastructure and residences? • How will sea level rise affect you? Video: https://pmm.nasa.gov/education/sites/default/files/videos/Melting_Ice_Rising_Seas_640x360.mp4
Lesson Title
What is Sea Level Rise
Lesson Length
2-3 days
Lesson Objective
SWBAT define sea level rise
Enduring Understandings
What is sea level rise and why does it matter?
Introduction
Do Now 1:
Lesson Activities
What do we know about climate change and sea level rise?
Closure
Look for photos of Philadelphia’s tide levels in the last decade. What could you find? How does that relate to what was done in class? What should be done with that information?
Checks for Understanding/Assessment
Student discussion questions, student article
Rising sea level is a threat to people that live near the ocean Which doesn’t belong? Justify your answer. Do Now 2: Would you rather? Justify your answer. What evidence can we use to see potential and current changes in sea level rise? King tides are the very highest tides that occur at each place. They: During extreme high tide events, we can get an idea of what a permanent rise in sea level might look like in our communities in the future. Have students in small groups review the previously captured images of king tides from the list found in the Photo Links section or from other sources, and discuss the following questions in preparation to share their observations with the rest of the group. Student questions: Discuss how scientists might use this array of photos including: See King Tides Initiative: http://california.kingtides.net/how-are-king-tides-photos-used/ How can we forecast sea level rise for the future? The steady rise in sea levels has been attributed to both a warming expansion of the oceans and contributions from melting glaciers and land-based ice sheets. Climate modeling combined with direct observations from tidal gauges and satellites suggest sea level rise will continue well into the future with significant implications for California’s coastal communities, but also for our local coastal communities here in Philadelphia. The predictions are predicting that we could lose the Philadelphia Airport and part of Delaware. Satellites provide a measure of the sea surface height. To gain an understanding of how satellites have built our knowledge watch the Sea Level Viewer Overview at: http://climate.nasa.gov/interactives/sea_level_viewer Some environments will be squeezed out or eroded with sea level rise; other environments and populations will need to retreat from the coast to survive both economically and ecologically. Determining how far to retreat to better ensure long-term success is difficult to determine without modeling. Scientists use models to understand the universe. A model is a physical or mathematical representation that helps to explain a phenomena that cannot be directly observed due to scale or time. Models are critical to scientists being able to communicate their work. They serve as simplified illustrations and enable predictions of future conditions. Scientists use current and past data in testing their models to see if the model works with the available data; they are then able to predict what is likely to happen. Sometimes there are several models for the same question, so that scientists can test their ideas. Inaccuracy in a model sometimes results from not having enough data. Climate models are often computerized and need to be continually tested and revised as we gain new data, thus continuing to refine our knowledge about climate. Together with the class look at sea level predictions found here http://coast.noaa.gov/digitalcoast/tools/slr, and discuss the following questions: Video: https://pmm.nasa.gov/education/sites/default/files/videos/Melting_Ice_Rising_Seas_640x360.mp4 Prompt 1 – Which doesn’t belong? Justify your answer. Do Now 2: Prompt 1 – Would you rather? Justify your answer. Locally, folks are making observations – and already seeing the impacts of sea level rise on their communities. Places such as Miami are now experiencing regular flooding in downtown city streets at high tide. The South Pacific island nation of Kiribati saw a 2.6 millimeter rise in sea level between 1992 and 2010. That may not seem like much, but when you consider that the land only sits about 2 meters above sea level, that’s a big deal; some villages have already had to relocate to escape the rising tides. Residents of China’s Yellow River delta are swamped by sea level rise of more than 25 centimeters (9 inches) a year. Even NASA is concerned about some of its facilities that are located in low-lying areas. Besides wiping out dry land, encroaching salt water can pollute our fresh water supplies and damage fresh-water dependent ecosystems. It’s not just fresh water rivers and lakes that are at risk – our aquifers, or natural underground water storage, are at risk of filling with salt water as the ocean encroaches on the land above them. Clearly, sea level rise is something that is already affecting people and will continue to do so. All three contributors to sea level rise can be attributed to the warming of the Earth system. Warming temperatures cause mountain glaciers and polar ice caps to melt, thereby increasing the volume of water in the oceans. At the same time, our oceans are getting warmer and expanding in volume as a result of this heat (thermal expansion). Since 1880, global sea level has risen 20 centimeters (8 inches); by 2100, it is projected to rise another 30 to 122 centimeters (1 to 4 feet). Watch this video for some illustrations of these facts: Which doesn’t belong? Justify your answer. Do Now 2: Would you rather? Justify your answer. Part 2: Small Group Analysis of Graphs – students interpret graphical data to gain an understanding of climate change. Break the students into groups of four. There are four different graphs, have different groups start with different graphs and then have the graphs circulate. Tell the students to examine the graphs with only the prompting question of “What can you tell/infer from the graph in from of you?” The group should write down several things that they observe or note. After the groups have seen all four graphs tell them to come up with a consensus about what the graphs are showing them. Part 3: Whole Group – Students examine data for misuse or misrepresentation. Teacher then tells students that the graphs came from the same set of data and gives the students all four graphs to look at, at the same time. Give the students a few minutes to look at all four graphs simultaneously so that the students can compare them side by side. This will allow students to try and find the differences and similarities between the sets of graphs. It is crucial to guide students into examining the x-and y-axis differences, Fahrenheit versus Celsius, and time scales such as 9 years in Graph 3 versus a 130 year time span in Graph 1 and 2. This will naturally flow into the idea of “scaling” and “perspective” in the visual representation of data. The teacher should make not of the differences in the ways that the data are displayed and understood, for example over 10 years versus 100 years, and that that can dramatically change the way the graph looks and in turn, the way we perceive the information. It is important at this point in the lesson for the teacher to clarify that none of these graphs are ‘wrong’ but rather were created from real data to lead the viewer to make certain assumptions. It may be particularly helpful to reference the similarities and differences of Graphs 3 and 4, in which the author selected a certain time frame in order to show little to no global temperature increase. However, the same data displayed in Graph 1 and 2 over 130 years shows that while there are variation in annual global temperature, the larger picture shows substantial average global temperature increase and therefore substantiates global climate change (akin to the headlines about the alleged “Global Warming Pause”). Part 4: Who would misuse the data? Why is it important to be informed? “Who would change data to create a positive or negative reaction, and why”? A great examples of this includes the media claims of a pause in global warming in late 2013 (Nuccitelli, 2013), Rep. Blackburn’s comments that a change in only 80 ppm of CO2 is a small thing, as well as recent sea ice data and the ways in which it could affect building in coastal communities (US Dept. of the Interior, 2009). Media reports about climate change have featured misleading representations of climate data. In early 2014, Representative Marsha Blackburn of Tennessee said “Look at what the warming is…we have gone from 320 ppm to 400 ppm…it’s very slight (NBC, 2014)”There are a number of reasons for intentional misuse of statistics/graphs and misrepresentation of visual data that students may recognize such causes as political agenda, financial gain of a particular group. Bill Nye Vs. Marsha Blackburn on Meet the Press Article to support cherry picking data A sub-objective of this lesson is to provide students with an understanding of what it means to be scientifically literate (AAAS, 1993) to navigate through various media information and examine what is presented to them for more than just face-value. Why do high-school students need to know this? At this point in the lesson, take 5 minutes to have students discuss (in small groups or Think-Pair-Share) some reasons why it will be important for them to be media and science literate? Being an informed citizen is crucial in understanding the political, economic, social and environmental issues our country and the world faces, and will also allow our students to be well-informed voters in a few years. In addition, it is important for high school students to understand their potential impact upon the planet and to being an informed voter, in all career paths Which doesn’t belong? Justify your answer. Do Now 2: Would you rather? Justify your answer. Do Now 3: Estimation 180 – Too low estimate, too high estimate, estimate, reasoning for estimate Do Now 4: What do you notice? What do you wonder? Do Now 5: Which doesn’t belong? Justify your answer https://www.youtube.com/watch?v=d9uTH0iprVQ Have students start with a journal response to the Ocasio-Cortez Video. Watch: https://www.natureworkseverywhere.org/resources/water-the-source-of-life/ https://www.youtube.com/watch?v=c-V0NI5fMDs Carbon footprint video…TBD Write a letter to Philadelphia’s Mayor Kenney, Pennsylvania’s Governor Tom Wolf , Senator Bob Casey, Pat Toomey, or your local House Representative (I can help you find out who that is, based on your voting district) making a convincing argument that climate change is happening as a result of human activities, supporting it with evidence from any information from the Data Bank or any additional research. In this letter make a plea to the elected official that changes have to happen. Describing your personal connections to specific public land that climate change will impact helps make your letter memorable and authentic. “The more specific you are, the more powerful your message will be and offering suggestions that Philadelphia and Pennsylvania can make. Share your knowledge. What you observe in your daily life might not be so obvious from inside a congressional office: your perspective might actually teach an official something new. Keep it short, and sweet. You’ll need some space to tell those personal stories, but don’t write a novel: the best letters are no longer than a single typed page. And of course, be civil. A strong argument in a respectful tone is more likely to be taken seriously than an all-caps rant. End your letter with a request. You can be general, such as asking your representative to put public land over private profit, or specific, letting them know how you’d like them to vote on a piece of legislation. (You can use govtrack.us to keep an eye on bills working their way through Congress.) Lesson Plan #1
Lesson Title
What is Sea Level Rise
Lesson Length
2-3 days
Lesson Objective
SWBAT define sea level rise
Enduring Understandings
What is sea level rise and why does it matter?
Introduction
Do Now 1:
Lesson Activities
What do we know about climate change and sea level rise?
Closure
Look for photos of Philadelphia’s tide levels in the last decade. What could you find? How does that relate to what was done in class? What should be done with that information?
Checks for Understanding/Assessment
Student discussion questions, student article
Lesson Plan # 2
Lesson Title
Sea Level Rise
Lesson Length
5 days
Lesson Objective
SWBAT
Enduring Understandings
How do we use data to demonstrate sea level rise?
Introduction
Do Now 1:
Lesson Activities
Closure
All of the information in the Data Bank can be grouped into four general themes, 1. Population growth, and the rise of greenhouse gas emissions, 2. Temperature rise, 3. Land ice melt, and 4. Sea Level rise. Each data source can be categorized or grouped into of these four themes. Write the theme on top of each data source.
Checks for Understanding/Assessment
Discussion Questions & Organizing the Data sources into the 4 overarching themes
Lesson Plan 3
Lesson Title
Using Global Climate Change as a Platform for Interpreting Graphical Data
Lesson Length
2 days
Lesson Objective
SWBAT translate quantitative or technical information into visual form IOT analyze and interpret data
Enduring Understandings
How can we use authentic data to interpret different types of graphs
Introduction
Do Now 1:
Lesson Activities
Part 1: Brainstorming Activity – Introduction to Climate Change. Have the students list what they know, different words that they feel are associated with climate change
Closure
Can you go home and find any examples from modern day or history of misuse of data
Checks for Understanding/Assessment
Evaluation of student examples brought in
Lesson Plan 4
Lesson Title
Teaching for Sustainability – A problem is a solution in the wrong place
Lesson Length
5 lessons
Lesson Objective
SWBAT write state legislators with the support of their data and what they have learned through the unit IOT demand changes be made to their city
Statement of Inquiry
Enduring Understandings
Introduction
Do Now 1:
Lesson Activities
Video: A Message From the Future With Alexandria Ocasio-Cortez – What if we actually pulled off a New Green Deal, What would the Future Look Like?
Closure
Reflection – How do these Habits support the kind of thinking that is necessary to solving problems like the Pacific Gyre or pure water or to promote zero waste? Which of the Habits of a Systems Thinker do I already practice?
Checks for Understanding/Assessment
The final assessment for this will be the letter to the state legislator with appropriate support to make their claim.
A Message From the Future With Alexandria Ocasio-Cortez [You Tube] The Intercept April 17, 2019 Alfrey, M. (2001) Making Secondary Math Sustainable. WWF-UK. Retrieved from: http://assets.wwf.org.uk/downloads/making_secondary_mathematics_sustainable.pdf American Association for the Advancement of Science. (1993). Benchmarks for Science Literacy. Project 2061. New York: Oxford University Press. Barlow, Z. and Stone, M. (2011). Living systems and leadership: Cultivating conditions for institutional change. Journal of Sustainability Education. Volume 2 Brock, Annie, and Heather Hundley. The Growth Mindset Coach: A Teacher’s Month-by Month Handbook for Empowering Students to Achieve. Berkeley, CA, Ulysses Press, 2016. This resource provides research about the benefit of providing students with real world problems. It discusses the importance of having the students be an active part of their math education Brundtland, G. (1987). Report of the World Commission on Environment and Development: Our Common Future. United Nations General Assembly. Retrieved from: https://www.kdp.org/initiatives/pdf/BrundtlandReport.pdf The Brundtland provided a definition of sustainability that had been released by the United Nations in the 1980’s. It is a definition that is still applicable today, if we think about it in a pure sense. Buchanan, M.K., Oppenheimer, M., and Kopp, R.E. (June 7, 2017) Amplification of Flood Frequencies with Local Seal Level Rise and Emerging Flood Regimes. Environmental Research Letters, Volume 12 Number 6. Retrieved from:https://iopscience.iop.org/article/10.1088/1748-9326/aa6cb3/meta Cloud, J.P. (2010). Educating for a sustainable future. Curriculum 21: Essential Education for a Changing World, Chapter 10. Washington, DC: ASCD Jaime Cloud outlines her definition of sustainable education and what it means to educate for a sustainable future. She addresses things that need to change within the curriculum and how we can make curriculum more authentic and relevant for the students to allow for students to engage with problem solving and critical thinking experiences to challenge them to solve problems to build their future. Cloud, J. (May 27, 2014). The Essential Elements of Education for Sustainability (EfS): Editorial Introduction from the Guest Editor. Journal For Sustainability, 2nd Issue. Retrieved from: http://www.jsedimensions.org/wordpress/content/the-essential-elements-of-education-for-sustainability-efs_2014_05/ Earth Science Communication Team. (May 23,2019). Nasa Climate Kids. Retrieved from: https://climatekids.nasa.gov/ Gleick, P. (2012, Feb 05). “global warming has stopped”? how to fool people using “cherrypicked” climate data. Forbes Magazine. Retrieved from: http://www.forbes.com/sites/petergleick/2012/02/05/global-warming-has-stopped-how-to-foolpeople-using-cherry-picked-climate-data/ Gutstein, Eric. “Teaching and Learning Mathematics for Social Justice in an Urban, Latino School.” University of Illinois—Chicago Journal for Research in Mathematics Education, 2003, vol. 34, no. 1, pp. 37–73. This resource provided the background knowledge as to why it is beneficial to teach math using social justice. Educating the students to take action and to be able to read, write, and communicate with the world around them is a step towards helping our students achieve equity. Hamilton, J. & Pfaff, T.J. (2014) Sustainability Education: The What and How for Mathematics, Primus, 24:1, pp. 61-80, DOI: 10.1080/10511970.2013.834526 Knaflic, Cole Nussbaumer. Storytelling with Data: A Data Visualization Guide for Business Professionals. Hoboken, NJ, Wiley, 2015. This resource provides information about Data Visualization and the process of improving data displays. Journal of Sustainability Education (2011). How our Teaching Changes our Thinking, and How our Thinking Changes the World: A Conversation with Jaimie Cloud. Retrieved from http://www.jsedimensions.org/wordpress/2011-living-and-learning-sustainability Masson-Delmotte, V., P. Zhai, H.-O. Pörtner, D. Roberts, J. Skea, P.R. Shukla, A. Pirani, Moufouma-Okia, C. Péan, R. Pidcock, S. Connors, J.B.R. Matthews, Y. Chen, X.Zhou,M.I. Gomis, E. Lonnoy, Maycock, M. Tignor, and T. Waterfield (eds.) (2018) Global Warming of 1.5°C. An IPCC Special Report on the impacts of global warming of 1.5°C above pre-industrial levels and related global greenhouse gas emission pathways, in the context of strengthening the global response to the threat of climate change, sustainable development, and efforts to eradicate poverty . World Meteorological Organization, Geneva, Switzerland. Retrieved from: https://www.ipcc.ch/sr15/ NBC. (2014, February 16). Meet The Press with Bill Nye and Representative Marsha Blackburn on Climate Change [Video file]. Rasmussen, D.J., Bittermann, K., Buchanan, M.K., Kulp, S., Strauss, B.H., Kopp, R.E., and Oppenheimer, M. (March 15, 2018). Extreme sea level implications of 1.5 °C, 2.0 °C, and 2.5 °C temperature stabilization targets in the 21st and 22nd centuries. Environmental Research Letters, Volume 13 Number 3. Retrieved from: https://iopscience.iop.org/article/10.1088/1748-9326/aaac87/meta Renert, M. (2011). Mathematics For Life: Sustainable Mathematics Education. For the Learning of Mathematics,31(1), 20-26. Retrieved from: http://www.jstor.org/stable/41319547 This resource helped connected sustainable education to the field of mathematics. It talked about examples of sustainability in the math classroom and what that could look like. Strauss, B., C. Tebaldi, S. Kulp, S. Cutter, C. Emrich, D. Rizza, and D. Yawitz (2016). Pennsylvania and the Surging Sea: A vulnerability assessment with projections for sea level rise and coastal flood risk. Climate Central Research Report. pp 1- 30. Retrieved from: http://sealevel.climatecentral.org/uploads/ssrf/PA-Report.pdf This resource provides details about the risks that Pennsylvania may face in its coastal regions if carbon emissions continue without human interference. There were maps and graphs that were helpful visuals. A Message From the Future With Alexandria Ocasio-Cortez [You Tube] The Intercept April 17, 2019 Climate Data Tools: https://www.ncdc.noaa.gov/cdo-web/ Earth Science Communication Team. (May 23,2019). Nasa Climate Kids. Retrieved from: https://climatekids.nasa.gov/ Gleick, P. (2012, Feb 05). “global warming has stopped”? how to fool people using “cherrypicked” climate data. Forbes Magazine. Retrieved from: http://www.forbes.com/sites/petergleick/2012/02/05/global-warming-has-stopped-how-to-foolpeople-using-cherry-picked-climate-data/ NBC. (2014, February 16). Meet The Press with Bill Nye and Representative Marsha Blackburn on Climate Change [Video file].Reading List:
Student Reading List
This unit incorporates standards from math, science, and humanities. It offers an interdisciplinary learning experience that allows the students to engage in both place-based learning and data analysis. It asks students to make sense of the problems that we face environmentally and persevere and coming up solutions for them. The students are asked to construct viable arguments and critique the reasoning of others using mathematic models and different sources of data. The unit offers a variety of different learning activities which makes it accessible for a diverse population of learners. Standards for Mathematical Practices Math Standards: Educating for Sustainability Standards: Environmental Science – Next Gen Science Standards · HS-ESS3-5 Earth and Human Activity – Analyze geoscience data and the results from global climate models to make an evidence-based forecast of the current rate of global or regional climate change and associated future impacts to Earth systems. State Standards A1.2.3.2.2 Analyze data, make predictions, and/or answer questions based on displayed data (box and-whisker plots, stem-and-leaf plots, scatter plots, measures of central tendency, or other representations) CC.2.4.HS.B.1 Summarize, represent, and interpret data on a single count or measurement variable CC.2.4.HS.B.5 Make inferences and justify conclusions based on sample surveys, experiments, and observational studies. A1.2.3.2.3 Make predictions using the equations or graphs of best-fit lines of scatter plots. A1.2.3.2.1 Estimate or calculate to make predictions based on a circle, line, bar graph, measure of central tendency, or other representation A1.2.1.2.2 Translate from one representation of a linear function to another (i.e., graph, table, and equation). National Standards CC.2.1.HS.F.3 Apply quantitative reasoning to choose and interpret units and scales in formulas, graphs, and data displays. CC.2.1.HS.F.5 Choose a level of accuracy appropriate to limitations on measurement when reporting quantitiesUnit Standards