
Global waste management includes the production, transportation, and long-term disposal of materials that are considered “trash.” How to deal with the unwanted byproducts of living in society is an ancient question with an extensive archeological and historical record. What is seen in those records is that as cultural norms and technology change across time and geography, what is considered trash, how much is produced, and how to dispose of it has led to many different solutions that can reduce threats to human and environmental health or exacerbate them.
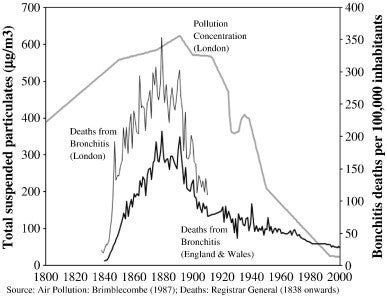
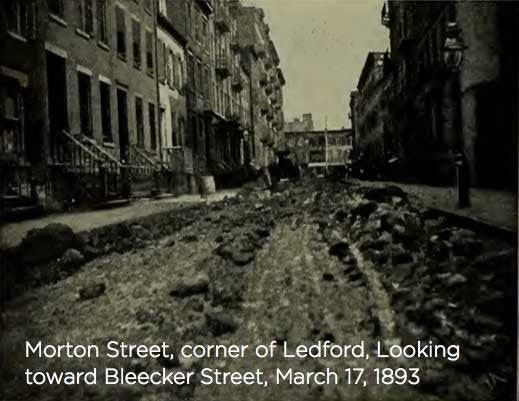
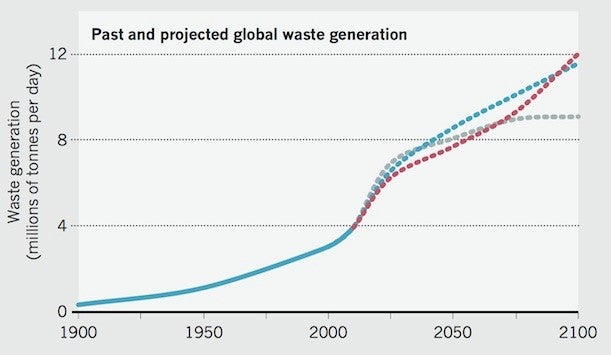
Cows poop. Trees fall in the forest. Yeast poison themselves to death in pursuit of life. All living things make waste products in some way. Humans are unique as the only organism that makes “trash.” We have created waste products so long-lived or hazardous that they cannot be returned to the Earth in biological decomposition. Perhaps worse than that, materials that could be composted, recycled, or incinerated are often stored in landfills rather than dealt with responsibly. What humans do with their “trash” is an ancient question that has evolved into a complex, multinational industry with its own problems and consequences. Wealth and poverty, culture and politics, human and environmental health, each play a role in the making, shipping, and final destination of garbage. This curriculum explores the origin of these waste crises, health and environmental issues resulting from them, existing solutions, and barriers to implementation. “Often people are not aware of the waste they produce. They get rid of it and that’s it. As soon as the charming lady dropped the cigarette pack, the problem was solved for her. The pack was on the ground and it suddenly no longer belonged to her. It is taken for granted that somebody else will do the cleaning up.” (Ludwig, 2003) In the anecdote above, the cigarette pack went from a useful container (valuable) to requiring a thought and a short walk to dispose of properly (obligation, negative value). The object itself did not change, but its context did. There could have been other intermediate uses for the trash. Perhaps someone could have burnt it for warmth or painted on it for art. If left on the ground, it would take a long time for the paper to decompose, and lifetimes longer for the cellophane. Maybe an animal would try to eat and choke on the plastic, or the dyes in the packaging leach out into the soil. Maybe someone else would find it ugly and complain about the aesthetics of the train platform. Because the definition of trash is so dependent on culture and context, there are many different ways of making trash. History shows us many different ways of producing and dealing with trash, as well as a few themes for encouraging more people toward better behaviors for the environment and its future. It is widely cited that the first legally documented trash crisis was in Athens, Greece around 500 BCE, when citizens were compelled to bring their garbage to a municipal dump more than a mile outside the city limits (Williams, 2005). In 1354, weekly waste collection was initiated in London (Khadijah, 2019), and in 1408, Henry IV passed a law that all urban households in England were to keep their waste indoors until a “raker” could remove waste to a dump beyond city limits (Williams, 2005). Another early waste solution included large scale incineration. When practiced by ancient Jewish people outside of Jerusalem in The Valley of Gehenna, the name of the fiery pit became synonymous with hell. Reuse, too, has an extended history. In China, a visiting American executive related the ancient practice of collecting human waste to be reused for communal agriculture (Sebastian, 1972). Across the Atlantic, a great deal of knowledge about Mayan daily life and dietary practices from 300 – 900 CE exist because of the unearthing and study of middens, domestic trash heaps (Halpern and Foias, 2016). Comparing their archaeological work in Guatemala to contemporary waste management practices, Hayden and Cannon (1983) theorized that humans in early CE were just as limited as humans today by how much effort it takes to dispose of unwanted material, the potential value of reusing it, and possible consequences of disposal methods. Looking at those three categories of what makes something “trash,” we see that something is more likely to become trash if it’s easy to dispose of, its reuse value is low, unclear, or requires effort, or there are hazards associated with poor management practices. Although waste disposal is a relatively common feature of human settlements above a certain population density, what is considered trash and how it is disposed of are particular to culture and geography (Halpern and Foias, 2016). A momentous change in human population density and the culture of trash was the Industrial Revolution. Generally spanning from the 1760s through 1840s, this period of economic and technological development saw people across Europe move increasingly to densely populated urban areas to work in factories (Yuko, 2021). The mass production made possible by new technology resulted in greater personal consumption, as well as a new category of high-volume waste from large-scale manufacturing (Williams, 2005). Amidst the huge technological and social changes, a cultural shift of surprising importance was the cultural relationship to “trash.” In the words of Susan Strasser, author of Waste and Want: A Social History of Trash, “Before the industrial revolution, trash was virtually unknown” (Powell, 2011). “In all cultures, people reuse stuff. That’s what the Industrial Revolution interrupted.” In an agrarian society, thrift and craftsmanship were necessities of life and culturally valued. In an age of mass production and new categories of “disposable goods,” “People who once made things now bought things.” Returning to Hayden and Cannon’s 1983 definition of what makes something trash, the mass production and ease of disposal created by the Industrial Revolution had greatly lowered the reuse value of materials whose reuse had been near-necessity on more isolated homesteads. Despite technological advances in production of waste, its management continued to rely largely on older practices. People in industrial England used horse drawn wagons to dispose of trash in open air dumps, “old quarries, closed coal mines, clay-pits, or nearby water sources such as rivers or sea dumping” (Khadijah, 2019). Although waste collection saw specialization of waste collectors in the 18th century, i.e. rag-and-bone men and “sewer dredgers” (Velis et al., 2009), as human population density increased, these older methods proved insufficient to safely deal with the increased volume of material and human waste, as well as being unable to combat the advent of air pollution from greater volumes and higher concentration of coal burning in industrial cities. Widely romanticized as a grim visual icon of Victorian era England, the dark factory clouds and towering chimneys of coal-burning London probably also contributed to an increase in infant death rate. Traditionally, the “urban mortality penalty,” correlating increasing population density with large increases in mortality, has primarily been explained by dirty water and poor disposal of human waste (Cain & Hong, 2009). However, Beach and Hanlon (2017), used spatial models correlating number of industrial workers to per capita coal consumption and found that, “a one standard deviation (SD) increase in log coal use raised infant mortality by 10.7–13.7 deaths per 1,000 live births, or about 8–10%. Moreover, we show industrial coal use explains roughly one-third of the urban mortality penalty for infants.” While a relatively simple mathematical model will have a wide margin of uncertainty, an increase in suspended particulate matter (SPM) in London is well documented (Brimblecombe, 1987). From 1800 to 1850, SPM increased significantly and is correlated to increased rates of death by bronchitis (Figure 1). Figure 1. Average concentration of suspended particulate matter in London relative to bronchitis deaths (Foquet, 2011) In the face of unprecedented waste management crises, three solutions with modern significance presented themselves as the 19th century unfolded. The first was the creation of public-private entrepreneurial opportunities somewhat akin to modern recycling practices (Velis et al, 2009). Starting in the London parishes could contract private contractors to collect household coal ash, which was a valuable source material for the brick industry. At centralized “dust yards,” They would then treat and separate the industrially useful materials to be sold for a profit. This economic model of recycling was different from the reuse of individual home owners or small communities prior to industrialization, in part because of its scale of organization. Another solution of the later 19th century was legal regulation of municipal solid waste management. In response to the cholera outbreaks of 1848–1858 that killed 250,000 residents, London implemented an underground sewage system by 1875 (Khadijah, 2019). In 1876 river dumping was banned, and in 1894, the Local Government Act required all municipal authorities to be responsible for “waste collection, disposal and sewage.” The ability of municipalities to enact and enforce these laws was a huge development compared to the previous century. “Formal law enforcement in eighteenth-century Britain left a great deal to be desired, and if a large number of economic agents had decided to renege on contracts and engage in blatantly opportunistic behavior, it is highly doubtful that the courts and law-enforcement agencies, such as they were, would have been able to dissuade them (Mokyr, 2010).” The last theme of the 19th century is that technological developments in waste disposal often generate their own problems. Although somewhat beyond the timeframe of the Industrial Revolution, London had developed such an advanced economy that by 1900, an estimated 50,000 horses traversed the city each day in hansom cabs and buses (Johnson, n.d.). New York City was similarly troubled, with at least 100,000 horses reportedly working in its streets. When horses were used in low-density agrarian societies, their daily production of 15 to 35 pounds of manure each day was spread out over a larger area and more readily absorbed by surrounding vegetation. However, when that much manure was being constantly deposited onto the cobble streets of an industrial city, the Times published a striking prediction that, “In 50 years, every street in London will be buried under nine feet of manure.” Figure 2 illustrates the sheer visual impact of one street corner’s worth of manure in 1893. Figure 2. Photograph of horse manure in New York City, March 17th, 1893 (Malpuri, 2019) Known as “The Great Horse Manure Crisis of 1894,” what to do with all the poo was discussed at the first international urban planning conference at 1898 in New York (Johnson, n.d.). However, despite the recent practice of municipal waste management in London, the delegates were unable to resolve the issue via private or public means. The solution was ultimately a consequence of the industrial technology that made London a thriving metropolis of horse poop. Changes in mass manufacturing of automobiles led to more affordable production and the obsolescence of horse-based transportation (Johnson, n.d.). Advent of the automobile also led to the development of the first trucks specifically designed for hauling refuse (Commendatore, 2018); however, while automobiles may have solved London’s poop problem, they contribute significantly to a variety of waste crises in the 20th century. While the Industrial Revolution may have been the foundation for mass production and new categories of pollution, the 20th century saw a nearly 400% increase in the mass of daily waste production as shown in Figure 3 (Stromberg, 2013). From the 1950 to 1990, per capita use of fossil fuels in Switzerland increased 500% and production of municipal solid waste by a factor of 4.3 (Ludwig, 2003). Figure 3. Past and projected global waste generation (Stromberg, 2013) The quality of our waste is changing. The 20th century gave rise to new materials that cannot be returned to the Earth in a human lifetime of biodegradation, including plastics (Song et al., 2009) and nuclear waste (Worldnuclear.org, 2022). Just as Victorian era Londoners could not imagine plastics and their consequences, we are continuing to design new technologies that could create even more challenging future-trash. In 2005, Bruce Sterling, futurist and godfather of cyberpunk, coined a new term “buckyjunk,” “to refer to future, difficult-to-recycle consumer waste made of carbon nanotubes, a.k.a. buckytubes, based on buckyballs or buckminsterfullerene (Sterling, 2005).” Although nanotubes and their waste materials have not yet become an industrial commodity, there are many garbage related horrors to populate our future nightmares. The creation of waste continues to outpace recycling at a significant rate (Hoornweg et al, 2013). As world population continues to increase, the situation is only expected to worsen. From the World Bank Group publication, What a Waste 2.0, “the world is on a trajectory where waste generation will drastically outpace population growth by more than double by 2050 (Kaza, 2018).” The increase in population is further complicated by the increasing urbanization of those populations. By 2050, the UN Report on Urbanization Prospects (2018) projects that 68% of humans would live in cities. At present, people who live in cities have increased consumption relative to people who live in rural areas, including producing “71-76% of CO2 emissions” and consuming “67-76% of global energy use.” For as many environmental crises as face the Earth, significant advances have been made in legal regulation and enforcement of waste production and distribution (Williams, 2005). Availability of low or no-carbon emitting energy sources are on the rise (IEA, 2021), and technological advances in disposal, recycling, and incineration of waste are also thankfully promising. There remain significant barriers to adoption and execution of these solutions, but education is a tool we can work on in the present to support a more sustainable future for our planet and all its inhabitants. As discussed above, what is useful in one context may be trash in another. Other than value and usefulness, a defining context of whether something is waste is if their consequences to its not being disposed of properly. Sometimes the consequence is purely aesthetic; “it looks dirty or trashy.” More frequently, something is a waste product if it needs to be removed to prevent consequences to human or environmental health. Historically, organic waste was a major health problem for cities. Decaying material attracting vermin, spread disease, and contaminated water supplies leading to epidemics (Ludwig, 2003). Some of the earliest “modern” sanitation movements were in response to human waste getting into the water supply and causing cholera outbreaks in London. Despite adequate technology existing to make clean drinking water accessible for everyone, lack of clean water is still a life-or-death issue for millions of people, and could become worse as glacial meltwater supplies dwindle as a result of climate change. Another problem of perishable organic waste is that it is easier and legally incentivized to throw away food rather than go through the expense or inconvenience of getting it to someone who would find it valuable. The UN Environmental Program’s Food Waste Index Report 2021 stated that more than 900 million tons of food waste were generated in 2019, 61% of which came from households with little difference whether a household came from a high- or low-income country. The report further adds that unconsumed food waste could be associated with 8 – 10% of annual global greenhouse gas emissions. Modern materials can also pose health and environmental challenges when present in the soil, water, or atmosphere (Ludwig, 2003). By definition, a material that is considered poisonous when found in the environment is pollution. Sometimes a product only becomes dangerous upon its incineration or aerosolization, such as in the burning of electronic “e-waste” and tire abrasion. This focus occupied the majority of our course of study, revealing that atmospheric pollution is particularly devastating for women, children, and people of color who bear a disproportionate burden of exposure to harmful air conditions. Although it is widely recognized that combustion engines produce waste exhaust that contributes to the greenhouse effect, the environmental impact of tire waste surprised me the most in this course content. In the United States every year, approximately one waste tire is produced for every living American, currently well over three-hundred million people (Gieré, 2022a). Tires are the number two source of ocean microplastics after the fashion industry, and different stages of their decomposition can be detected in water, soils, and the atmosphere. Globally, tire particle emissions approach nearly six million tons of waste product annually (Gieré & Dietze, 2022). The primary source of tire microplastics is through abrasion. Every time a tire makes contact with road surface, small particles are transferred onto the asphalt. The amount of abraded materials increases during the friction of braking when the tire is not rotating, but scraping against the road surface. During the friction of braking, the heat and abrasion further transform the particles, the composition and impact of which is under active investigation. Both of these sources of pollutants are expected to worsen with more widespread adoption of electric vehicles (EVs) (Gieré, 2022a). While EVs reduce their direct emissions of greenhouse gases into the atmosphere, current lithium batteries increase the weight of the vehicle. The greater the mass of the vehicle, the greater force of friction between the tires and the brakes. This leads to tires wearing out more quickly and leaving more abrasion particles on the road surface. Whether EV or combustion engine vehicles, the impacts of these pollutants are geographically concentrated and create undue health concerns for humans and other living things with higher rates of exposure. Because modern agriculture requires long-haul transportation and logistics for its existence, many large agricultural operations are alongside highways and high-traffic thoroughfares. The high volume of industrial agriculture harvests also frequently requires the use of heavy trucks, which emit abrasion particles at rates much higher than standard vehicles (Figure 5) (Gieré & Dietze, 2022). Figure 5. Heavy-duty vehicles have higher emission factor (Gieré & Dietze, 2022) Another challenge about tire abrasion particles is the difficulty in identifying their composition. Modern tires are no longer mostly made of rubber sourced from trees, but from a wide variety of synthetic materials, fillers, and additives to extend tire life cycle and aesthetics (Figure 6) (U.S. Tire Manufacturer’s Association, 2020). The exact composition and quantity of those additional chemicals is proprietary information. Rather than tire companies sharing their knowledge in order to better serve the public, it is the burden of academic and private research groups to sample and identify the abrasion particles in order to test their adverse health impacts. Figure 6. Tire composition for light and heavy vehicles (U.S. Tire Manufacturer’s Association, 2020) One known source of adverse health impacts from tires is atmospheric zinc. Itself a product of the Industrial Revolution, vulcanization is a process used for enhancing the performance of the rubber (hardness, elasticity, strength). Modern vulcanization often utilized zinc oxide (ZnO) as the most efficient catalyst to produce a road-worthy tire (Mostoni, 2019). However, zinc is a very volatile metal and easily aerosolizes during incineration (Gieré, 2022a). The health impacts of long-term, low exposure to zinc (~0.5–2 mg zinc/kg/day) include decreased copper absorption, which can manifest as anemia with lower numbers and percentage of red blood cells (U.S. Department of Health and Human Services, 2005). Although tires are one source of aerosolized heavy metal exposure, electronic consumer goods (e-waste), also contribute a great deal of metal and other hazardous wastes into the environment and cause different symptoms at high levels of exposure. The definition is flexible, but electronic consumer goods that are no longer in use are often called e-waste and include a wide variety of products, including refrigerators, air conditioners, washers, and dryers, calculators, TVs, computers, phones, children’s toys, household appliances, certain lamps, and specialized tech devices like GPS and routers (CalRecycle, n.d.). That’s not even the whole list! In part because this category of waste is a more recent development, these devices can be enriched in hazardous materials that may not be as present in other types of solid waste, especially heavy metals, polyaromatic hydrocarbons (PAHs), fire retardants, and chlorofluorocarbons (CFCs) (Gieré, 2022c). Despite these materials posing known health and environmental risks, disposal of e-waste is in an abysmal state. Globally, about 17% of e-waste is recycled (Gieré, 2022c). The value of those recovered materials was estimated at $10 billion USD. Although it saves materials from landfilling, recycling the raw materials does not mean avoiding health and environmental contamination. At an informal recycling facility in Guiyu, China, cadmium and lead PM2.5 concentrations were higher near the facility than in cities without an e-waste recycling facility (Zheng, 2016). According to U.S. EPA guidelines, the total cancer risk of these conditions is higher than the safe acceptable range for both children and adults, with higher risks posed for children. Another informal recycling facility, Agbogbloshie in Accra, Ghana, has nearly 10,000 workers who sort through e-waste, sometimes crushing and burning plastics to recover valuable metals for reclamation (Yeung, 2019). When 142 workers were equipped with cameras and PM2.5 particle measurement equipment, 90% of them exceeded the World Health Organization PM2.5 target of 25 µg m−3 (average of 81 µg m−3) (Laskaris, 2019). “Burns, back problems, and infected wounds are common ailments among these workers, as well as respiratory problems, chronic nausea, and debilitating headaches—brought on by the hazardous working environment and toxic air pollution (Yeung, 2019).” This informal recycling is much cheaper than safe containment procedures and documenting compliance with all regulations, and a lot of the waste comes illegally from Western Europe and the United States (Yeung, 2019). At present, the UN estimates 50 million tons of e-waste is thrown away each year, and this is expected to increase 100% by the year 2050. The opportunity to extract valuable resources from this “waste” provides employment for poor citizens of Accra, as well as supporting immigrants from Niger, Mali, and the Ivory Coast. Julius Fobil, a professor at the University of Ghana’s School of Public Health summed it with devastating simplicity, “They earn a living, but their health suffers” (Yeung, 2019). Figure 7. Spittelau Incinerator in Vienna, Austria (Kotschan, 2017) Figure 8. Amager Bakke incinerator in Copenhagen, Denmark (de Valence, 2019) Across Europe in 2016, ~46% of waste was recycled or composted (European Parliament, 2018). For the Netherlands, Germany, Belgium, Denmark, Austria, Sweden, and Finland, landfilling was the management solution for less than 2% of their waste (European Parliament, 2018). Although several of these countries boast higher than average rates of recycling, these countries primarily use incinerators to burn the remaining trash and recuperate “waste energy.” Using waste as an energy source requires changes at different steps to increase efficiency and safety, but incineration power plants work on the same principles as traditional fossil fuel energy generation. Combustible materials are used to convert water into steam. The steam spins a turbine, moving magnets around a wire to induce the movement of electrons. Some facilities distribute heat in addition to electricity. Other benefits accrue in addition to energy recovery with a reduced carbon dioxide footprint (Gieré, 2022d). Using incineration reduces the total volume of waste, can reduce its toxicity, bioavailability, and risk of leaching. It increases recycling efficiency by extracting valuable non-combustible resources and creating raw materials for industrial processes like concrete (Gieré, 2022d). One of the undeniable limits of incineration is that it still emits carbon dioxide. Writing for PBS in 2019, Ana Baptista claimed that municipal funding for incinerators also competes with more long-term sustainability projects such as reducing plastic at the source or carbon-neutral energy production. The issue of non-CO2 air pollutants, such as “nitrogen oxides, sulfur dioxides, particulate matter, lead, mercury, dioxins and furans,” has a few complicating factors, one of which is aging and maintenance of filtration systems. As of 2019 (Baptista, 2019), there were 72 operating waste incineration plants in the United States. Of these, ~75% were over 25 years old with an average life expectancy of 30 years. Only one operating facility had been built in the U.S. since 1995. After the passage of the 1990 Clean Air Act Amendments, many facilities underwent dramatic upgrades to meet new emissions standards. “From 1990 through 2005, the U.S. waste-to-energy industry lowered its own SO2 emissions by 88% and NOx by 24%, according to EPA. It has reduced emissions of lead, cadmium, mercury, and particulates by 96%. The industry went from emitting 58% of the dioxins in the U.S. in 1986 to less than 0.1% in 2012 (Tullo, 2018).” A reduction of emissions is not its complete elimination, however. Different municipalities have different compositions of waste and thus different emission spectra over time and geography. Another complication of the U.S. emission hazards is that 80% of the existing incinerators are located in communities where 25% or more of the nearby residents are low-income, people of color, or both (Baptista, 2019). This undue burden of exposure is an environmental justice issue that must be considered in discussions of incineration as a waste solution. One of the arguments against incineration is that it disincentivizes absolute reduction in the volume of trash (Baptista, 2019). Acknowledging a waste incineration sustainability director might be biased, Michael Van Brunt of Covanta believes the two aims can coexist, stating, “The only ton of waste that doesn’t have an impact is the ton that you don’t generate, but then the next best thing is to recover energy to the extent that we can, and that is where we fit, right below recycling” (Tullo, 2019). Different materials have different possibilities for reuse and recycling. Tires have a reuse possibility, from construction material in Earthship berms to incorporation in playgrounds, garden mulch, asphalt rubber, and shoe soles (Gieré, 2022b). Glass was intentionally reused during the mid-20th century in the U.S. economy of milkmen. People all over the world have mended shoes and clothing rather than throwing them out, or created quilts and other functional fabrics from smaller scraps that could no longer be repurposed. That these tasks often involve creativity or artistic vision brings me to the heart of my waste solution project. One way to reduce the amount of trash in the world is to repurpose it for art. In Philadelphia, our most famous reuse of trash is by muralist Isaiah Zagar. Trained at Pratt and exposed to a huge breadth of art in Peru through the Peace Corps, he returned to bohemian South Street in the mid-1960s. Creating, collaborating, and constructing what would become “Philadelphia’s Magic Gardens,” his primary art media are tile and salvaged material bonded together with construction materials (Philadelphia Magic Gardens, 2022). Figure 9. Philadelphia Magic Gardens collaborations with Mark Blumentstein (left) and Warren Muller (right) (Philadelphia Magic Gardens, 2022) Although our classroom waste does not often include bike wheels or industrial piping, paper and chip bags could become easy targets for repurposed art. I would love to include a tribute to Isaiah Zagar by constructing large-scale murals out of “trash.” I also like the idea of making effigies of large fossil fuel corporate logos and burning them, but I suspect this would be frowned upon by administration if supported by our pyromaniacal teens. An extension unit that may or may not be adopted is to create window gardening units from repurposed trash, fill them with compost from the Fairmount Park system, and to grow plants with natural dye properties for the students to color their works on paper. If visual art is not the emotional connection that draws in a student, the “Recycled Orchestra” offers a musical solution. A youth orchestra organized around Catetura, Paraguay, a landfill that receives over 3 million pounds of solid waste each year, teaches its young people on instruments created from repurposed waste materials (Tsioulcas, 2016). Favio Chavez, an environmental engineer who lived near the dump, began teaching music in his free time and asked a local carpenter for help building instruments out of materials from the landfill. Although carpentry and engineering are likely beyond the ability of the average classroom teacher, there are a number of resources available for accessible, DIY creation of pitched and percussive instruments out of household goods. With art at the heart of the project, the research component of the project would be to study and explain where the waste would have gone if taking the traditional trash can, school dumpster, garbage truck route. What resources could a student use to find where our trash goes? How does it get there? What problems does it cause once there? Accepting that not all human trash could be repurposed for art, what other solutions exist? Are there nations or municipalities that have exceptional ideas for managing waste? What individual choices can we make that might influence those larger governing bodies? What emotions will we experience in the face of huge problems and relative powerlessness? It is my vision that the course of this project will start with simple, hands-on engagement. “What can we make out of this trash?” By researching what would have happened to our beautiful art, it is my hope that the emotional connection will be stronger than disposing of “any old trash.”History of “Trash”
Ancient History
Advent of the Industrial Revolution
20th Century and Beyond
Consequences
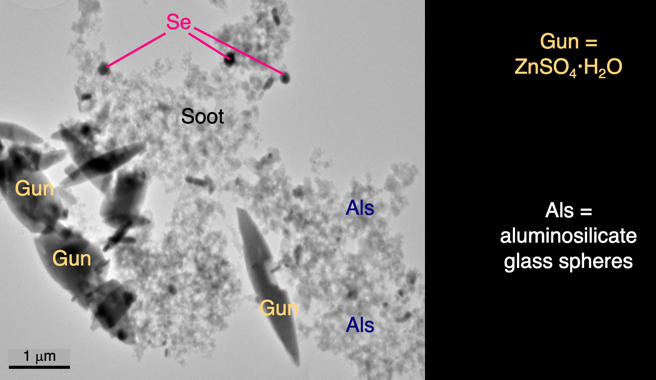
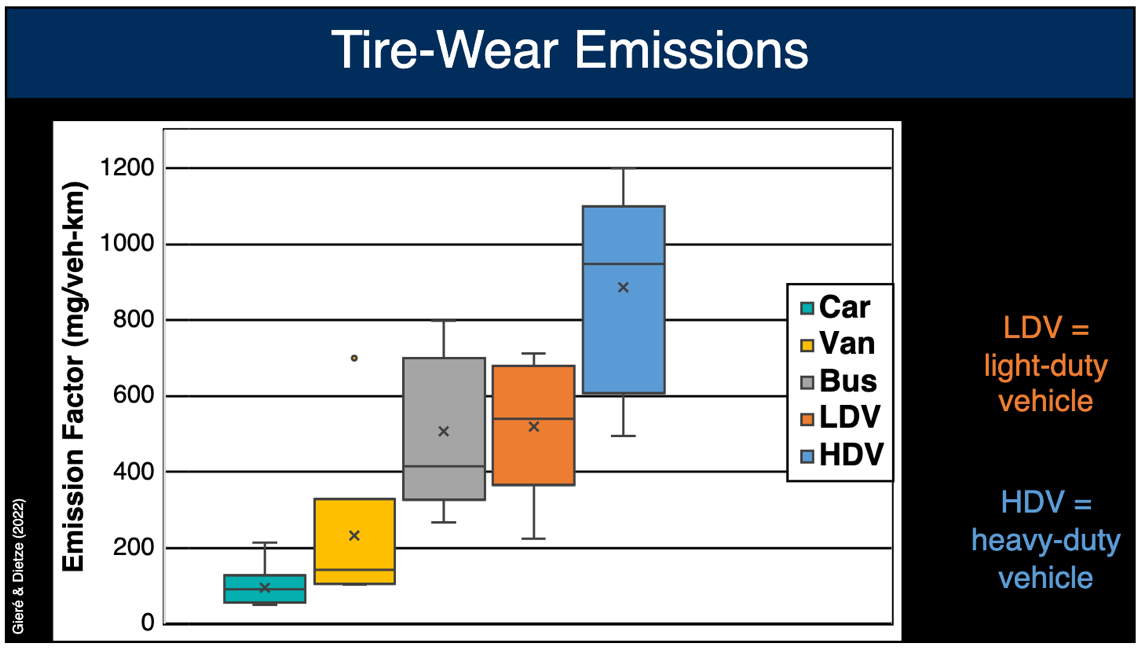
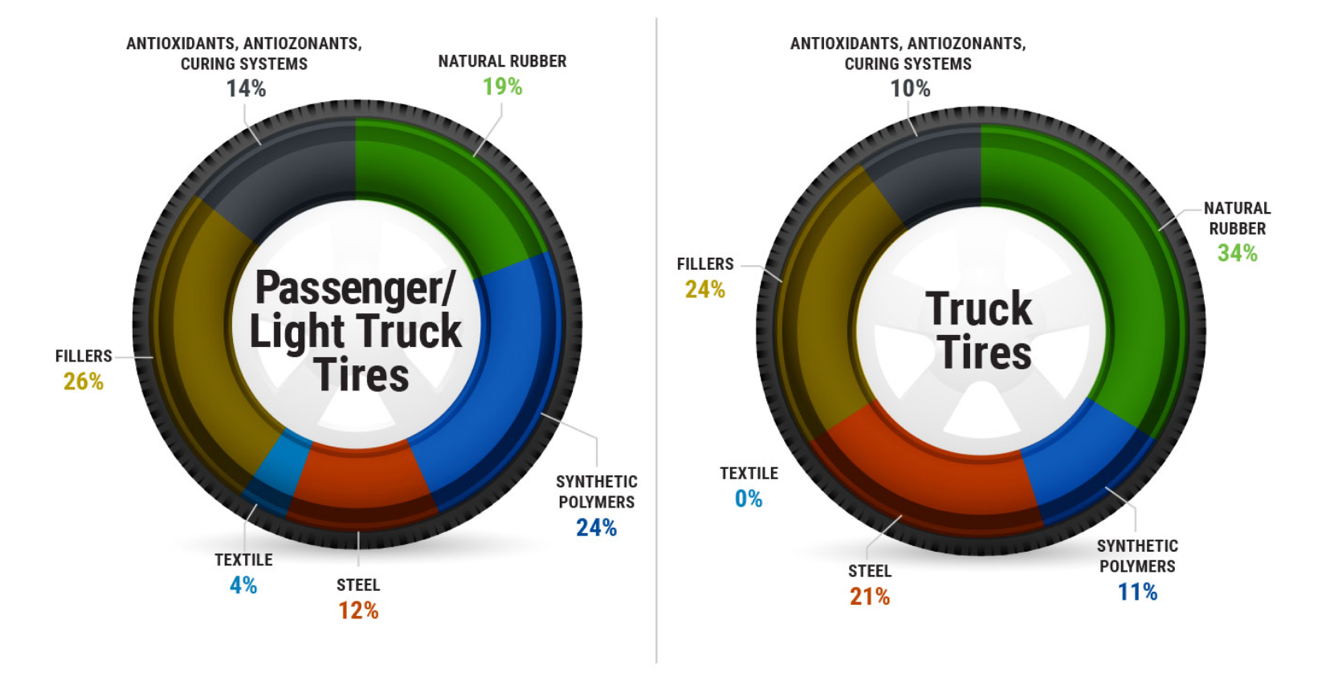
Tires
e-Waste
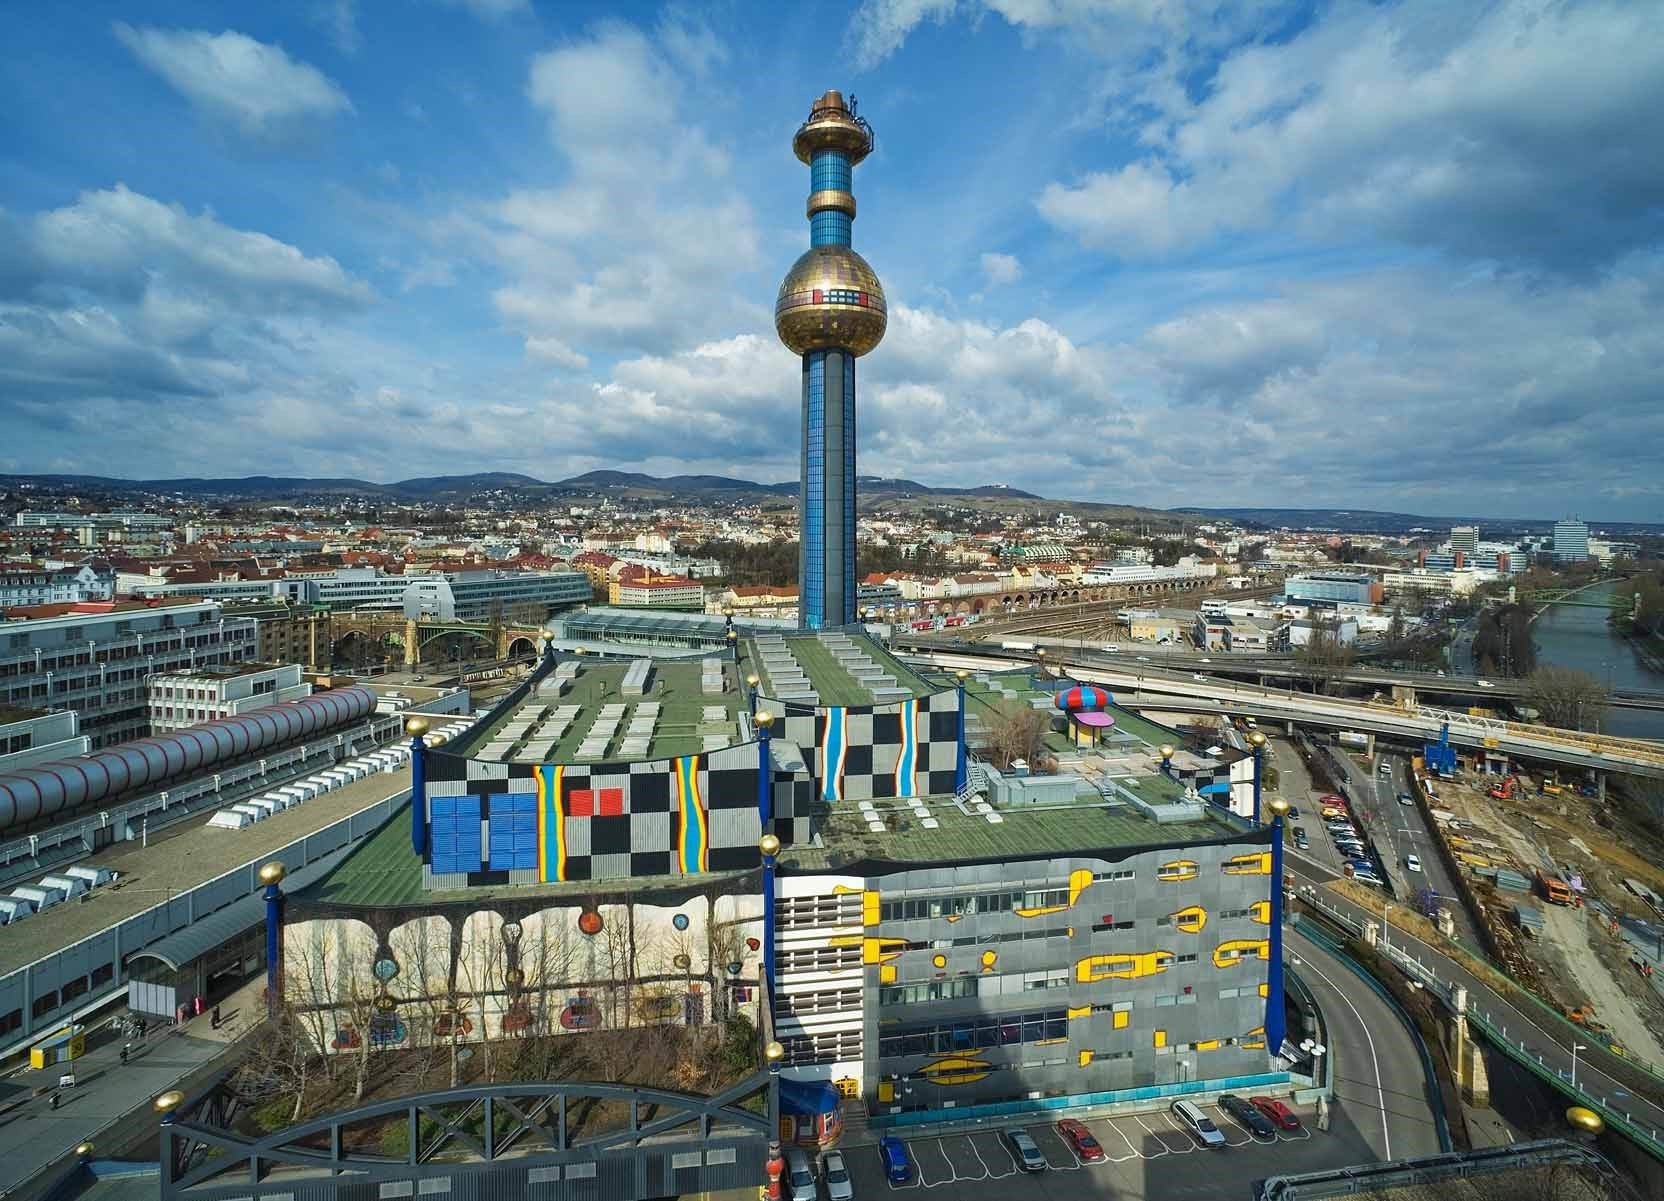
Solutions
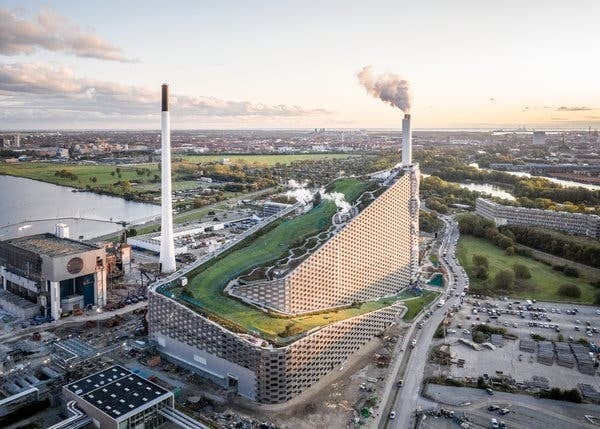
Reuse: Energy and New Life
Art


“Students who physically experience scientific concepts understand them more deeply and score better on science” (Ingmire, 2015). According to functional MRI scans performed by psychologist Sam Beilock at the University of Chicago (Ingmire, 2015), students who used their hands to actively complete an experiment referenced those sensory and motor regions of the brain during exams, while students who watched videos or manipulated virtual components did not experience the same activation of brain regions and, when assessed, scored lower on the same metrics. While this study was demonstrated in college physics students, the Next Generation Science Standards (NGSS) uses the same, hands-on phenomenon-based research approach in science classrooms of all ages. There are eight key science and engineering practices, including planning and carrying out investigations and analyzing data (NGSS, 2013). Depending on content matter, it is relatively easy to incorporate a hands-on philosophy, although obtaining the necessary time and materials can be a limiting factor for teachers in the School District of Philadelphia and beyond. Although Project Based Learning (PBL) often incorporates aspects of hands-on science labs and data analysis, it is a slightly larger framework that requires a real-life, outward facing application of the final product (PBLworks.org, n.d.). Our school recently painted over our old murals with lead-safe paint (another waste crisis not discussed in this paper). As a result, the bare gray walls are available as mural space for movable, student-centered mosaic murals created from repurposed trash. By making students aware that their work would be featured in the school for other young people to see, it encourages higher levels of engagement, and ideally, a higher quality product as a result of the effort. Over the course of hands-on labs and formally presenting their final project, students will need to graph data, create and analyze charts, and physically construct a large-scale mosaic project with possibility for weaving, folding, and affixing paper to itself and other waste materials. While use of mathematics is an NGSS Science and Engineering practice, the use of art skills will be directed toward the NGSS practice, “communicating your findings.” Together, the use of arts and sciences in the classroom can be called by the acronym STEAM (science, technology, engineering, arts, mathematics). This creates a classroom dynamic that allows students to see the relationships between the different disciplines more apparent in real-world design than our isolated high school subject material (Educate.today, n.d.). PBL requires students to develop background knowledge as part of the solution to their complex, long-term problem. By preparing videos with essential information on climate change and industrial waste management, they practice listening, writing, and summarizing information with unlimited attempts at gaining the knowledge and the ability to save it indefinitely, unlike a class lecture that is only delivered once in person.Teaching Strategies
Hands-On Laboratory Experiments
Project Based Learning
Interdisciplinary Skill Development: STEAM
Interactive Videos for Background Knowledge
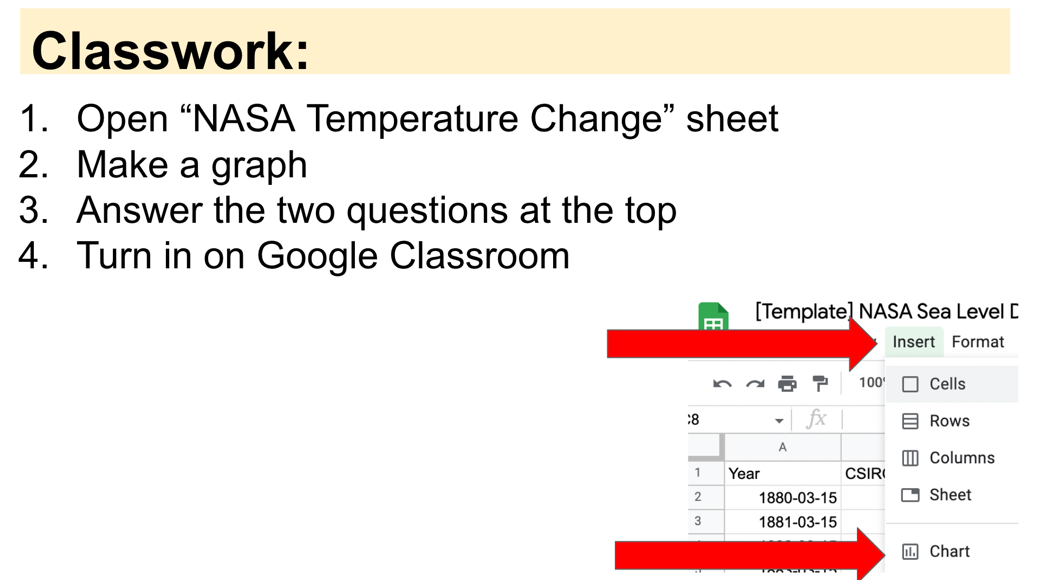
In this hands-on activity conducted over 90 minutes, students experimentally demonstrate the relationship between increased carbon dioxide and increased temperature. Lab report and instruction questions available in Appendix. Materials: Procedure: Collaborate with team to prepare working stations with appropriate access to outlets and recording materials Install “Vernier Graphical Analysis” software and calibrate temperature and CO2 measurement equipment Measure equal volumes of water into two sealed containers adding generic Alka-Seltzer into one of them to mimic increased carbon dioxide in the atmosphere Collect temperature data for one hour, then measure CO2 at end for both experimental conditions Analyze rate and absolute values of increased measurements Google Sheet Dataset Template: NASA Land and Ocean Temperature Anomaly (1800 – 2010) Video: How to create a chart in Google Sheets BIO.B.4.2.4 Describe how ecosystems change in response to natural and human disturbances (e.g. climate changes, introduction of non-native species, pollution, fires). In this hands-on activity conducted over three 90-minute classes, students construct a group mural using trash generated by our school and calculate a lifecycle analysis of what materials they are sequestering by preventing decomposition in a landfill. Materials: Procedure: Phila SD Office of Content Instruction Environmental Science Year-at-a-Glance Weeks 1-2 Change and Stability in Ecosystems: How can we (and why should we) measure the health of an ecosystem? HS-LS2-2 Use mathematical representations to support and revise explanations based on evidence about factors affecting biodiversity and populations in ecosystems of different scales. BIO.B.4.2.4 Describe how ecosystems change in response to natural and human disturbances (e.g. climate changes, introduction of non-native species, pollution, fires). BIO.B.4.2.5 Describe the effect of limiting factors on population dynamics and potential species extinction. Weeks 3-4 Disturbances in Ecosystems: How do relatively stable ecosystems respond to changing external conditions? HS-LS2-6 Evaluate the claims, evidence, and reasoning that the complex interactions in ecosystems maintain relatively consistent numbers and types of organisms in stable conditions, but changing conditions may result in a new ecosystem. Weeks 5-6 Human Impact Project: How can we design a solution to reduce the impact of human activities on the environment? HS-LS2-7 Design, evaluate, and refine a solution for reducing the impacts of human activities on the environment and biodiversity. Weeks 7-8 Human Impact Project: How can we evaluate and refine our solution? Weeks 9-10 Assess and ReteachClassroom Activities
Demonstrating Relationship of Carbon Dioxide and Temperature
Graphing NASA Temperature Datasets

Trash to Treasure: Making Art from Waste
NGSS HS-LS2-7.
Design, evaluate, and refine a solution for reducing the impacts of human activities on the environment and biodiversity.
Quarter 4
Baptista, A. (2019, June 23). Is burning trash a good way to dispose of it? Waste incineration in charts. PBS.org. https://www.pbs.org/newshour/science/is-burning-trash-a-good-way-to-dispose-of-it-waste-incineration-in-charts Beach, B. & Hanlon, W. W. (2017, November). Coal smoke and mortality in an early industrial economy. The Economic Journal, 128 (November), 2652–2675. DOI: 10.1111/ecoj.12522 Brimblecombe, P. (1987). The Big Smoke: A history of air pollution in London since Medieval times. Methuen & Co. Cain, L. & Hong, S. (2009). Survival in 19th century cities: the larger the city, the smaller your chances, Explorations in Economic History, vol. 46(4), pp. 450–63. CalRecycle. (n.d.). What is e-waste? CA.gov. https://calrecycle.ca.gov/electronics/whatisewaste/ Commendatore, C. (2018, November 14). Then and Now: A Look at How the Garbage Truck Has Evolved. Waste360.com. https://www.waste360.com/trucks/then-and-now-look-how-garbage-truck-has-evolved de Valence, S. (2019, October 24). The Slopes Are Green at Copenhagen’s First. Ski Hill. Really. The New York Times. https://www.nytimes.com/2019/10/23/travel/copenhagen-ski-hill-powerplant.html Educate.today (n.d.) Using STEAM Strategies. https://educate.today/edvideos/using-steam-strategies EPA (2022, February 25) Global Greenhouse Gas Emission Data. Environmental Protection Agency. https://www.epa.gov/ghgemissions/global-greenhouse-gas-emissions-data European Parliament. (2018, April 6). EU waste management infographic with facts and figures. News European Parliament. https://www.europarl.europa.eu/news/en/headlines/society/20180328STO00751/eu-waste-management-infographic-with-facts-and-figures Fouquet, R. (2011). Long run trends in energy-related external costs. Ecological Economies 70(12), 2380-2389. Gieré, R. (2022). Tire-to-Energy. [In-person lecture]. Gieré, R. (2022). Tire-to-Energy. [PDF]. Gieré, R. (2022). e-Waste. [PDF]. Gieré, R. (2022). Waste-to-Energy. [PDF]. Gieré R. & Dietze V. (2022) Tire-abrasion particles in the environment. In: Heinrich G., Kipscholl R., Stocek R. (eds): Degradation of Elastomers in Practice, Experiments and Modeling; Advances in Polymer Science; Springer, Berlin, Heidelberg; pp. 31. DOI: https://doi.org/10.1007/12_2022_118 Halperin, C.T. and Foias, A. (2016). Household Garbage : Classic period (ça. 300-900 CE) Maya Practices of Discard, Palethnologie, 8. DOI : https://doi.org/10.4000/palethnologie.520 Hayden, B. and Cannon, A. (1983). Where the Garbage Goes: Refuse Disposal in the Maya Highlands, Journal of Anthropological Archaeology, 2 (2), 117-163. Holmes, K. (2011, September 21). Talking to the Future Humans. VICE.com https://www.vice.com/en/article/ex777e/talking-to-the-future-humans-bruce-sterling-technology-augmented-reality-hacktivism Hoornweg, D., Bhada-Tata, P. & Kennedy, C. (2013) Environment: Waste production must peak this century. Nature 502, 615–617. https://doi.org/10.1038/502615a IEA. (2021). Global Energy Review 2021. International Energy Agency. https://www.iea.org/reports/global-energy-review-2021/renewables Ingmire, J. (2015, April 29). Learning by doing helps students perform better in science. University of Chicago News. https://news.uchicago.edu/story/learning-doing- helps-students-perform-better-science Johnson, B. (n.d.) The Great Horse Manure Crisis of 1894. Historic UK: The history and heritage accommodation guide. https://www.historic-uk.com/HistoryUK/HistoryofBritain/Great-Horse-Manure-Crisis-of-1894/ Kaza, S. et al., (2018). What a waste 2.0: A global snapshot of solid waste management to 2050. The World Bank Group. https://openknowledge.worldbank.org/handle/10986/30317 Khadijah Abd. Gani, S. (2019). Drivers of early waste disposal activities in England. WIT Transactions on Ecology and the Environment, Vol 231. WIT Press. https://eprints.soton.ac.uk/429142/1/WM18027FU1_1_.pdf Kotschan, M. (2017, March 29). The Spittelau incinerator: symbiosis of technology, ecology and art. Plastic le Mag. https://plastics-themag.com/The-Spittelau-incinerator:-symbiosis-of-technology-ecology-and-art Laskaris, Z., Milando, C., Batterman, S., Mukherjee, B., Basu, N. O’neill, M. S., Robins, T. G., Fobil, J. N. (2019) Derivation of time-activity data using wearable cameras and measures of personal inhalation exposure among workers at an informal electronic-waste recovery site in Ghana, Annals of Work Exposures and Health, Volume 63, Issue 8, October 2019, Pages 829–841, https://doi.org/10.1093/annweh/wxz056 Ludwig, C., Hellweg, S., & Stucki, S. (2003). Municipal solid waste management, strategies and technologies for sustainable solutions. Springer. Malpuri, R. (2019, April 29). In response to New York Mayor de Blasio’s glass building ban. View.com. https://view.com/blog/smart-windows-improve-health Mokyr, J. (2010). Entrepreneurship and the Industrial Revolution in Britain. In D. S. Landes, et al., The Invention of Enterprise: Entrepreneurship from Ancient Mesopotamia to Modern Times. Princeton University Press, 2010. ProQuest eBook Central, http://ebookcentral.proquest.com/lib/upenn-ebooks/detail.action?docID=483494. Mostoni, Milana, Credico, D’Arienzo, & Scotti. (2019). Zinc-Based Curing Activators: New Trends for Reducing Zinc Content in Rubber Vulcanization Process. Catalysts, 9(8), 664. https://doi.org/10.3390/catal9080664 PBLworks.org. (n.d.) What is PBL? Buck Institute for Education. https://www.pblworks.org/what-is-pbl Philadelphia Magic Gardens (2022). About Isaiah Zagar. https://www.phillymagicgardens.org/about-us/about-isaiah-zagar/ Philadelphia Magic Gardens (2022). Mark Blumenstein. https://www.phillymagicgardens.org/highlights-from-the-collection/mark- blumenstein/ Philadelphia Magic Gardens (2022). Warren Muller. https://www.phillymagicgardens.org/highlights-from-the-collection/warren- muller/ Powell, Alvin. (2011, September 23). The return to recycling. The Harvard Gazette. https://news.harvard.edu/gazette/story/2011/09/the-return-to-recycling/ Ritchie, Hannah (2017, June 20). What the history of London’s air pollution can tell us about the future of today’s growing megacities. Our World in Data. https://ourworldindata.org/london-air-pollution Sebastian, Jr., F. (December, 1972). Waste Treatment in China: Ancient Traditions and High Technology. Ambio , Dec., 1972, Vol. 1, No. 6. pp. 209-216. Springer on behalf of Royal Swedish Academy of Sciences. Retrieved from URL: https://www.jstor.org/stable/4311985 Song, J. H., et al. (2009). Biodegradable and composable alternatives to conventional plastics. Philosophical Transactions of the Royal Society of London B: Biological Sciences. 2009 Jul 27; 364(1526): 2127–2139. DOI: 10.1098/rstb.2008.0289 Sterling, B. (2005, December 1). Dawn of the carbon age. Wired.com. https://www.wired.com/2005/12/dawn-of-the-carbon-age/ Stromberg, J. (2013, October 30). When Will We Hit Peak Garbage? Smithsonian Magazine. https://www.smithsonianmag.com/science-nature/when-will-we-hit-peak-garbage-7074398/ Tsioulcas, Anastacia (2016, September 14). “From Trash to Triumph: The Recycled Orchestra.” NPR. https://www.npr.org/sections/deceptivecadence/2016/09/14/493794763/from-trash-to-triumph-the-recycled-orchestra Tullo, A. (2018, September 24). Should plastics be a source of energy? Chemical & Chemical Engineering News. https://cen.acs.org/environment/sustainability/Should-plastics-source-energy/96/i38 United National Environment Programme (2021). Food Waste Index Report 2021. Nairobi. United Nations Department of Economic and Social Affairs (2018). World Urbanization Prospects. Department of Economic and Social Affairs, pp. 10. https://population.un.org/wup/Publications/Files/WUP2018-Report.pdf U.S. Department of Health and Human Services (2005, August). Toxicological profile for zinc. Public Health Service Agency for Toxic Substances and Disease Registry. https://www.atsdr.cdc.gov/toxprofiles/tp60.pdf U.S. Tire Manufacturers Association (2020). What’s in a tire. U.S. Tire Manufacturers Association. https://www.ustires.org/whats-tire-0 Velis, C.A., Wilson, D.C. & Cheeseman, C.R. (2009). 19th century London dust-yards: A case study in closed-loop resource efficiency. Waste Management, 29, pp. Williams, P. T. (2005). Introduction. Waste Treatment and Disposal, 2nd ed. John Wiley & Sons, Ltd. Worldnuclear.org (2022, January). Radioactive waste management. WorldNuclear.org. https://www.world-nuclear.org/information-library/nuclear-fuel-cycle/nuclear-wastes/radioactive-waste-management.aspx Yeung, P. (2019, May 29). The Toxic Effects of Electronic Waste in Accra, Ghana. Bloomberg. https://www.bloomberg.com/news/articles/2019-05-29/the-rich-world-s-electronic-waste-dumped-in-ghana Yuko, E. (2021, November 18). How the Industrial Revolution Fueled the Growth of Cities. History.com. https://www.history.com/news/industrial-revolution-cities Zheng, X., Xu, X., Yekeen, T.A., Zhang, Y., Chen, A., Kim, S.S., Dietrich, K.N., Ho, S.M., Lee, S.A., Reponen, T. and Huo, X. (2016). Ambient Air Heavy Metals in PM2.5 and Potential Human Health Risk Assessment in an Informal Electronic-Waste Recycling Site of China. Aerosol Air Qual. Res. 16: 388-397. https://doi.org/10.4209/aaqr.2014.11.0292Resources
Works Cited
Materials
Background Information Video: “NASA’s Earth Minute: Gas Problem” Video Demonstration: “The Greenhouse Gas Demo” by Erik Christensen Evaluation Rubric for Carbon Dioxide Lab Report Section Header: Group Members Points: 4 Question: Include first and last names. List everyone including you! Section Header: Pre-Lab Question(s) Points: 9 Question: Answer questions completely and in complete sentences. Section Header: Lab Title Points: 4 Question: Write a Meaningful and Informative Title Section Header: Purpose Points: 9 Questions: Sentence Requirement: 1-2 Use descriptive verbs Purpose in the world, not just for class Section Header: Introduction Points: 9 Questions: Answers all questions summarizing background information and important details. Section Header: Equipment/Materials Points: 9 Questions: List all equipment and materials used. If equipment/materials change, document the changes. Section Header: Procedures Points: 9 Questions: Copy from handout provided or summarize in complete sentences. YOU make the decision. If we make changes to the procedure in class, document them. Section Header: Data Points: 9 Questions: Create data table Write one sentence under each graph describing what is increasing, decreasing, or staying the same. Uses specific numbers and units Section Header: Calculations Points: 9 Questions: Show all work. Use complete sentences to explain calculations Section Header: Question(s) for Analysis Points: 9 Questions: Sentence Requirement: 3+ Answer all questions. Section Header: Conclusion(s) Points: 20 Questions: Sentence Requirement: 5+ Use descriptive verbs Compare the hypothesis to the results. Use information you collected from Data, Calculations, and Analysis to support your answer, even if the lab experiment does not work. Video: The Story of Stuff Google Sheet Dataset Template: NASA Land and Ocean Temperature Anomaly (1800 – 2010) Video: How to create a chart in Google Sheets Teach Engineering laboratory summary, “Particulate Matter: For Your Eyes Only”Appendix
FOLLOW THE FORMAT!