
Issues of sustainability and the effect of nonrenewable and renewable fuels are experienced in this unit using hands-on exercises and problem solving. Students create and analyze algebraic models for fossil fuels and green (non-fossil) fuel automotive data for cars. The unit also contains a lesson which simulates the use and depletion of nonrenewable energy and the effect of its replacement with renewable energy. Lastly students are engaged in creating motion graphs which match supplied graphs and determining the equation of the linear models using a motion detector. This curriculum unit is written for high school mathematics students in grades 9 through 11 who are studying Algebra 1 or Algebra 2. This curriculum unit could also be used in science courses such as physical science, environmental science or physics since it provides experiences creating real data and determining the mathematical models in science.
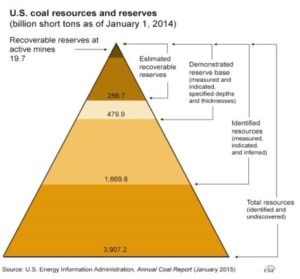
The environment is of national and international concern. United States government agencies and private concerns have as their mission finding solutions to environmental issues, particularly our ability to lower greenhouse gases by lowering pollution, securing our energy future by lowering energy consumption and finding new renewable energy. The uses of natural resources, energy consumption, global warming and fuel are hotly debated in many circles. Frequently the debate centers around energy sources, their effects on the environment and the implications for future generations. Is it Sustainable? This is a question asked frequently among those who debate the environment and our ability as humans to chart a course which will allow us to inhabit the earth for generations to come. There are many issues: global warning, pollution, fossil fuel depletion – to name a few. Understanding the issues and making the changes necessary to solve the problems is the challenge before us. In this case, “it” refers to the use of fossil fuels. As a country we depend almost exclusively on a mixture of coal, oil, and natural gas for energy. Fossil fuels are non-renewable, so their availability is finite – that is, they will eventually dwindle, becoming too expensive or too environmentally damaging to retrieve. By comparison, there are many types of renewable energy resources-such as wind, solar energy and hydrogen fuels-that can be constantly replenished and will never run out. This dilemma also creates an educational opportunity: to raise awareness of the problem and use that awareness to create authentic learning in US classrooms. High school students frequently live in their own world devoid of real time issues and solutions. While they are unaware of many issues, when teenagers are given the resources and educational tools to understand and tackle problems they become powerful advocates and leaders. The high school students, for whom this unit is written, will study sustainability in environmental science and will study data modeling in algebra 1 and 2. The curriculum unit will provide lessons which relate the energy issues and offer an opportunity to apply environmental related exercise to math modeling. The objective of the seminar, Penn Laboratory on Energy, Sustainability and Environment was “to integrate mathematics and science in order to develop an understanding of quantities, rates of change of quantities, and their relationships to everyday situations, physical systems, and public policy decisions”. To meet these objectives the seminar used technology that captured data from physical situations and students developed and built mathematical models for the data and made predictions. The subjects of energy and sustainability were the platforms for our learning. This curriculum unit will introduce students to issues concerning sustainability as it relates to fuel. The unit will use data for fuels and the environment to provide hands- on/experiential mathematical learning. The issue of sustainable energy is important for our future and is therefore one in which the next generation can get involved. This year the United States Congress is debating plans for clean power. These plans will set standards to reduce carbon dioxide emissions based on 2005 levels and achieve the levels by 2030. President Obama has proposed lowering carbon dioxide emission by 32 percent by 2030 and believes that this standard if adopted and passed to states for implementation will put us on a track for sustainability (EPA, 2015). The opposition believes that the plan is “a “draconian” and “job-killing” assault on the coal industry that will jack up America’s utility bills.” (Whitehouse, 2015) So why all the fuss? The answer lies in the history of American fossil fuel energy usage and its effect on the environment. Fossil fuels have been a source of energy since humans discovered and began using coal along with burning wood for energy. It may be said that the fossil fuel era began when fire was discovered in prehistoric times. More often, it is said that the fossil fuel era began with the advent of the Industrial Revolution in the 1700s. Although wood was the first combustible fuel for thermal energy after fire was discovered and remained in use for many thousands of years, the use of a higher-specific-fuel became desirable by the thirteenth century for production of charcoal. The use of coal, the first fossil fuel employed in quantity, increased steadily over the next 400 years. As the use of fossil fuels increased the use of biomass (renewable fuels decreased. (Kruger, 2009). From Neolithic times through the eighteenth century technology changed very little. Then the steam engine began using energy in the 1700s, cities in Europe began using natural gas and the combustion engine and steam ships used fossil fuels in the 1800’s (Ebsco Host Science). These nonrenewable fossil fuels: coal, oil, natural gas will eventually be depleted and thus conservation efforts are underway. United State dependency on foreign sources of oil and gasoline was accentuated during the oil crisis of the early 1970’s and so a focus on automobile fuel efficiency began. Use of fossil fuels also harms the environment. The energy released when fossil fuels are burned was captured by plants millions of years ago and compressed in the earth. As fossil fuels are burned the by-product, carbon monoxide, a pollutant, is released into the air. Usage of fossil fuels has increased over time as more people populate the earth and more cars, houses, industry and power plants need them for power. 1990-2008 Others: Mathematically calculated, includes e.g. countries in Asia and Australia. The use of energy varies between the “other countries”: E.g. in Australia, Japan, or Canada energy is used more per capita than in Bangladesh or Burma. Fossil fuels also cause environmental issues. The atmosphere surrounding the earth traps heat from the sun around the earth so that it is warm enough for human habitation. Too little heat and it is cold and too much heat and it is too hot. Carbon dioxide, other gases and pollutants trap more heat in the atmosphere causing the greenhouse effect and global warming. In some states, like Texas, 96% of the energy used makes greenhouse gases. (Infinite Power, 2014). In addition, coal drives the production of electricity so a key factor in lowering greenhouse gases involves finding alternate energy sources for electricity production. In addition to energy production for industry, energy production contributes heavily to state economies. For instance, Pennsylvania is the leading East Coast provider of coal, natural gas, nuclear power and refined petroleum products. Just behind Texas, Pennsylvania is the nation’s second largest natural gas producer – producing 15 times 2009 levels since the development of the Marcellus Shale. It is the fourth largest coal producing state. One of the top three electricity-generating states in the nation, Pennsylvania exports electricity to the Mid-Atlantic region making electricity important to state revenue. (Eia, 2015). Hard industry is heavily affected by clean air regulations as new rules can be costly to implement. Both these nonrenewable energy sources are important to Pennsylvania. How long will they last? The US Energy Information Administration estimates that the total recoverable domestic coal resources are 256.7 billion short tons. Based on US coal production in 2013 at 984.8 million short tons coal reserves would last for 261 years. As demand continues to increase particularly in China, anticipated coal supply reserves are expected to drop. (Eia, 2015). New, renewable energy sources which don’t rely on natural nonrenewable resources and can be replaced at a rate comparable to their use are needed. These renewable sources such as solar, wind, water (wave), hydro, geothermal and biomass (plant) will be important for sustainability. The United States currently obtains 4% of its energy from renewable sources. In Pennsylvania, where renewable energy historically came from hydroelectric and biomass power plants, wind power has grown to provide two-fifths of renewable electricity. (Eia, 2015). Electric power is also being used to lower US dependency on automobile fossil fuel usage. In 1976, Congress authorized a committee to examine the potential for the development of electric vehicles to reduce US dependency on fossil fuels. Hybrid automobiles, cars having engine systems that are both gas and electricity power, have proliferated over the last decade. This year the 2015/2016 model cars include more electric cars than any other year (Edmondson Report, 2015). High in fuel mileage, electric cars provide an economic alternative for short distances. Electric cars are expected to become more affordable once electric filling stations make longer travel possible and increased demand for the vehicles helps to lower the sticker price.
Regional energy use (kWh/capita & TWh) and growth 1990–2008 (%)[25][26]
Population Growth
Energy use (1,000 TWh)
Region
1990
2008
Growth
1990
2008
Growth
USA
250
305
22%
22.3
26.6
20%
EU-27
473
499
5%
19.0
20.4
7%
Middle East
132
199
51%
2.6
6.9
170%
China
1,141
1,333
17%
10.1
24.8
146%
Latin America
355
462
30%
4.0
6.7
66%
Africa
634
984
55%
4.5
7.7
70%
India
850
1,140
34%
3.8
7.2
91%
Others*
1,430
1,766
23%
36.1
42.2
17%
The World
5,265
6,688
27%
102.3
142.3
39%
Source: IEA/OECD, Population OECD/World Bank
While primarily focused on high school mathematics, the objective of this curriculum unit is to enable students to experience the connections between math and science and gain a perspective on past issues and future implications involving sustainability. This unit will study the environmental issues around alternative fuels and provide lessons for students to engage in mathematics investigations within the environmental theme. The objectives of the unit are: The lesson plans are designed for students studying Algebra 1 and Algebra 2. This unit could also be used in science courses studying sustainable energy. PA Common Core Standards are incorporated into the curriculum unit. Students will accomplish math standards by analyzing data and using the results to draw conclusions. They will interpret data and develop the equation of the line and slope of the line to establish relationships and graphs. Science standards will also be accomplished as students use multi-step processes and use technology to solve complex problems.
This curriculum unit will meet the objectives discussed above through problem based, hands on lessons. The Mathematics Pennsylvania Common Core Standards will be addressed by students identifying and using the rate of change to solve real life problems; by calculating and interpreting the equation of a line as well as translating data from table to graph. Given a set of data students will analyze the data and determine the best algebraic or graph representation.
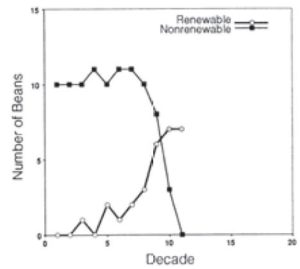
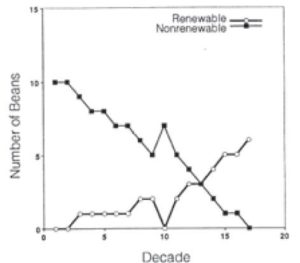
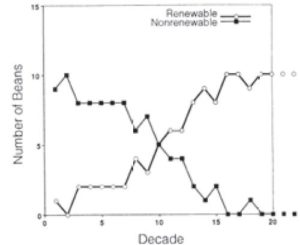
The classroom activities consider several different issues regarding sustainability. In lesson one, students will analyze and compare the costs and create algebraic models using sets of cost and fuel efficiency for automobiles. The Pennsylvania Common Core Standards in mathematics of modeling relationships between quantities and graphing and analyzing the functions are also required in lesson two. In this lesson, a simulation of depleting natural resources while replenishing resources using different proportions of two colors of bingo chips increases student learning about renewable and nonrenewable energy. It also models constructing linear models to solve problems. Lesson three allows students to make data using a motion detector, technology and graphing calculators. This lesson provides a vehicle for students to not only graph functions but to use the analysis to make connections between the different graphs and experience being the maker of the data. Title: Is it Worth It? Goals: To create and analyze algebraic models using automobile data in order to understand the dynamics of green cars and sustainable energy. Materials: Graph paper, prices and fuel economy for traditional and energy-efficient cars (sample car data is provided below), graphing calculator to model graphs after pencil paper; internet access for research. Introduction: In an effort to reduce the carbon monoxide released into the atmosphere due to fossil fuels used in cars, automobile manufacturers have developed new cars with more energy efficient and/or sustainable energy features. This exercise uses algebra to analyze several green energy car options. Car Option information: ($) Miles/gallon Source: www.edmunds.com; www.bluebook.com; www.toyota.com Modeling: Challenge: Conservationists would factor in more than the payback period to determine the value of a “green car”. Use the internet to research what other factors should be considered? What data would you use and where would you find it? Factor your new information into the analysis. Is a Green car worth it? Adapted from Renew-a-Bean: A Guide to Teaching Renewable Energy in Junior and Senior High School Classrooms. © Revised and updated 2003 by the Union of Concerned Scientists, All rights reserved www.ucsusa.org/sites. Used with permission. Original activity adapted from Conserve and Renew: An Energy Education Package for Grades 4–6, Sonoma State University, 1990. Title: Renewables to the Rescue Goal: To demonstrate the use and depletion of nonrenewable resources over time in order to highlight the importance of energy sustainability. Through the activity, students experience the eventual depletion of fossil fuel resources and the existence of renewable resources changes the rate of energy use. Materials: Brown paper bags (1 for each group) containing 100 x ¾ inch bingo chips: 94 of one color (amazon.com), six of another color, extra chips of both colors: 10 of first color, 40 of second color, five copies of the student handout (copies in the appendix); extra graph paper. Introduction: This activity demonstrates use and depletion of nonrenewable sources over time and emphasizes the difference between renewable and nonrenewable resources. It shows students that nonrenewable sources will be exhausted over time. Moreover, it shows that conservation measures—ways of using less energy—along with increased use of renewables can slow the depletion of fossil fuels. The intent is to simulate depletion of nonrenewable resources but may not model the proportions based on real energy data. The difficulty of this activity can be adjusted for different grade levels. Time: Two 45-minute class periods Procedure: Class discussion: Title: Making Models from Real-Life Data Adapted from Walking the Line – Straight Line Distance Graphs Real-World Math with Vernier: Connecting Math and Science Lab Book © Vernier Software & Technology; Explorations A Move in the Right Direction © Texas Instruments Incorporated Reproduced with permission Goals: Mathematical models of events in the real world are created from data related to every day events and situations. In this lesson, students will create and use data to develop a real world model using simple motio Introduction When one quantity changes at a constant rate with respect to another, we say they are linearly related. Mathematically, we describe this relationship by defining a linear equation. In real-world applications, some quantities are linearly related and can be represented by using a straight-line graph. In this activity, students will create straight-line, or constant-speed, position versus time plot using a Motion Detector, and then develop linear equations to describe these plots mathematically. Objectives: Materials: TI-84 Plus graphing calculator, CBR 2 or GoMotion motion detector, TI-CBL2 (Calculator Based Laboratory), graphing paper, student handout. Procedure: The group should examine the graph produced and compare it to the sample graph. If the two graphs are very different, the group should repeat the experiment until they are satisfied with the results. Groups may want to establish a “walking strategy” based in what they see on the graph before they start each experiment (e.g. Look at the graph, consider how fast or slow the graph appears to be rising or falling). The x-axis represents time and the experiment starts at time =0; the y-axis represents distance from the sensor. The walker begins 1.0 feet from the sensor. Additional graphs and other information can be found in the appendix.Lesson Plan 1 Evaluating Green Cars and Fuel Efficiency through Algebraic Modeling
Make
Model
Engine Type
Price
Fuel Economy
City
Hwy
Toyota
Prius Hatchback
Hybrid
$24,200
51
48
Toyota
Prius Hatchback
Plug-in
$29,990
95
(95)
Toyota
Camry Sedan
Gasoline
$22,970
25
35
Toyota
Camry Sedan
Hybrid
$27,840
43
39
Ford
Fusion Sedan
Gasoline
$34,645
22
34
Ford
Fusion
Hybrid
$39,075
44
41
Lesson Plan 2
Lesson Plan 3:

“Clean Power Plan for Existing Power Plants.” Regulatory Actions. US Department Environmental Protection Agency, 3 Aug. 2015. Web. 4 Aug. 2015. <http://www2.epa.gov/cleanpowerplan/clean-power-plan-existing-power-plants>. This website includes articles, reports, charts, tables and multiple energy related articles Connection.ebscohost.com. N.p., n.d. Web. <http://connection.ebscohost.com%2Fscience%2Falternative-energy-exploration/history-alternative-and-renewable-energy>. An informed discussion of the history of energy and renewable energy Kruger, Paul. Alternative Energy Resources: The Quest for Sustainable Energy. Hoboken, NJ: John Wiley & Sons, 2006. Print. This book not only provides a detailed history of energy it also links energy topics with math and math models. “Pennsylvania State Energy Profile.” Pennsylvania Profile. US Energy Information Administration, n.d. Web. 8 Aug. 2015. <http://www.eia.gov/state/print.cfm?sid=PA>. The energy information specific to Pennsylvania from the US government. “President Obama’s Plan to Fight Climate Change.” The White House. The White House, 7 Aug. 2015. Web. 8 Aug. 2015. <https://www.whitehouse.gov/climate-change>. Website provides details of President Obama’s plan for climate change. Watts, Robert G. Innovative Energy Systems for CO2 Stabilization. Cambridge, UK: Cambridge UP, 2002. Print. This book provides a lot of information on the issues of CO2 and the importance of lowering emission. Chu, Steven, and Arun Majumdar. “Opportunities and Challenges for a Sustainable Energy Future.” Nature 488.7411 (2012): 294-303. Web. 15 May 2015. Article explaining the issues and challenges of sustainable energy Explorations. N.p.: Texas Instruments Incoporated, n.d. Print. Easy in class labs using the Texas Instruments TI-84 series calculators Gastineau, John E., Chris Brueningsen, Bill Bower, Linda Antinone, and Elisa Kerner. Real-world Math with Vernier: Connecting Math and Science. N.p.: n.p., n.d. Print. Lessons and hands-on experiments using probes. This book and Vernier offer excellent learning opportunities for students. Randolph, John, and Gilbert M. Masters. Energy for Sustainability: Technology, Planning, Policy. Washington, D.C.: Island, 2008. Print. Energy issues with policy and practice Renewables Are Ready: A Guide to Teaching Renewable Energy in Junior and Senior High School Classrooms. Cambridge, MA: Union of Concerned Scientists (Two Brattle Square, Cambridge 00238-9105), 2003. Print. A textbook on renewable energy “Temperature – Precipitation – Sunshine – Snowfall.” Climate Philadelphia. N.p., n.d. Web. 22 July 2015. <http://www.usclimatedata.com/climate/philadelphia/pennsylvania/united-states/uspa1276/2015/6>. This website provides both national and regional climate information Energy Kids (www.eia.gov/kids) is a student-friendly website hosted by the U.S. Department of Energy, Energy Information Administration (EIA). The site includes a variety of information and activities about energy organized in several main categories: What is Energy?, Sources of Energy, Using & Saving Energy, History of Energy, Games and Activities, for Teachers, Related Links, Energy Calculators, and a Glossary.Resources
Other Teacher Resources
Student Reading List
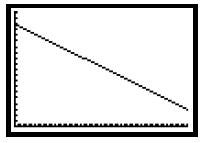
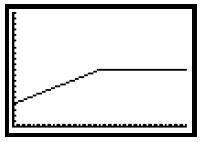
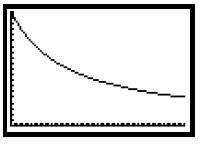
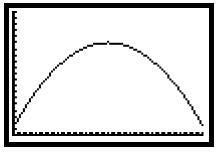
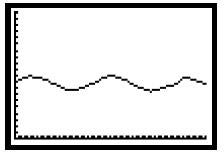
Student Handout – Chip Record Sheet Group Member Names: Directions: Students in each group should take turns drawing chips from the bag until the total number indicated for the decade have been drawn. Record the number of renewable and the number of nonrenewable chips drawn on the chart. Return any renewable chips drawn to the bag after recording on the chart they can be used again. Set all nonrenewable chips aside, they are used up. Draw chips from the bag again, this is decade 2. Record your results on the chart. Each chip represents energy usage. Draw chips until there are no more nonrenewable chips in the bag. Chips Chips Chips Chips Add renewables Add renewables Example graphs for the variations in round 3 Student Handout – Chip Record Sheet – Round 3 Group Member Names: Directions: Students in each group should take turns drawing chips from the bag until the total number indicated for the decade have been drawn. Record the number of renewable and the number of nonrenewable chips drawn on the chart. Return any renewable chips drawn to the bag after recording on the chart they can be used again. Set all nonrenewable chips aside, they are used up. Draw chips from the bag again, this is decade 2. Record your results on the chart. Each chip represents energy usage. Draw chips until there are no more nonrenewable chips in the bag. Chips Chips Chips Chips 1. For each experiment, use the data collected by the calculator to plot your graph and determine the slope and the equation of the line. Explain the differences in the walking, to produce each graph. What similarities and differences are there in the equations? 2. Create two new graphs of your own determine how you will walk to create each graph. Find the slope and equation of the line for each graph. a. Which walker started walking closest to the sensor? Explain. b. Which walker moved at a faster rate of speed? Explain. Estimate the rate each person was walking. c. Which graph was created by the walker moving toward the sensor? Some extensions of the lesson: Students can consider not linear graphs as dictated by course content and student knowledge of exponential, quadratic, and trigonometric functions (See graphs below).
Round 1
Round 2
Decade
Total # Chips Drawn
Renewable
Non renewable
Decade
Total # Chips Drawn
Renewable
Non renewable
1
10
1
10
2
10
2
10
3
10
3
10
4
10
4
10
5
10
5
10
6
10
6
10
7
10
7
10
8
10
8
10
9
10
9
10
10
10
10
10
Variations for Round 3
Variation
Simulation
1
Energy usage increases by four percent per decade (round to the nearest whole number); Graph results
2
Energy usage decreases by two percent per decade (round to the nearest whole number); Graph results
3
Energy usage decreases by four percent per decade (round to the nearest whole number); Graph results
4
Availability of renewable energy increases by six percent per decade (round to the nearest whole number); Graph results
5
Availability of renewable energy increases by ten percent per decade (round to the nearest whole number); Graph results
Chips to be Drawn for Group Bags in Round 3
Variation 1
Variation 2
Variation 3
Variation 4
Variation 4
Variation 5
Variation 6
Decade
Total # Chips Drawn
Total # Chips Drawn
Total # Chips Drawn
Total # Chips Drawn
Total # Chips Drawn
Total # Chips Drawn
Total # Chips Drawn
1
10
10
10
10
0
10
0
2
10
10
10
10
0
10
1
3
11
10
10
10
1
10
0
4
11
10
9
10
0
10
1
5
12
9
9
10
1
10
1
6
12
9
8
10
0
10
1
7
13
9
8
10
1
10
1
8
13
9
8
10
1
10
2
9
14
9
7
10
0
10
1
10
14
8
7
10
1
10
1
11
15
8
7
10
1
10
2
12
16
8
7
10
1
10
2
13
–
8
6
10
0
10
2
14
–
8
6
10
1
10
2
15
–
–
6
10
1
10
3
16
–
–
6
10
1
10
2
17
–
–
6
10
1
10
3
18
–
–
–
10
1
10
3
19
–
–
–
10
1
10
4
20
–
–
–
–
–
10
4
21
–
–
–
–
–
10
4
22
–
–
–
–
10
5
Variation 1
Variation 2

Variation 3
Variation 4

Variation 5
Round 3
Variation
Round 3
Variation
Decade
Total # Chips Drawn
Renewable
Non renewable
Decade
Total # Chips Drawn
Renewable
Non renewable
1
1
2
2
3
3
4
4
5
5
6
6
7
7
8
8
9
9
10
10
11
11
12
12
13
13
14
14
15
15
16
16
17
17
18
18
19
19
20
20
21
21
22
22
Graphs for Experiments
1.

2.

3.
4.

5.
Questions:
Problems for Additional Exploration
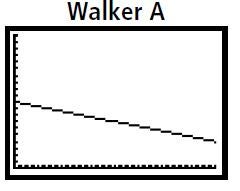
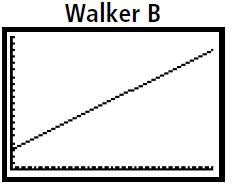
The graphs shown above represent two different walkers, A and B, moving in front of the motion sensor.
MATHEMATICS CC.2.1.HS.F.4 Use units as a way to understand problems and to guide the solution of multi-step problems. CC.2.2.8.B.3 Analyze and solve linear equations CC.2.2.8.C.1 Define, evaluate, and compare functions. CC.2.2.8.C.2 Use concepts of functions to model relationships between quantities. CC.2.2.HS.C.3 Write functions or sequences that model relationships between two quantities. CC.2.2.HS.D.7 Create and graph equations …to describe numbers or relationships. Define, evaluate, and compare functions. CC.2.2.8.C.2 Use concepts of functions to model relationships between quantities. CC.2.2.HS.C.2 Graph and analyze functions and use their properties to make connections between the different representations. CC.2.2.HS.C.3 Write functions or sequences that model relationships between two quantities. Apply quantitative reasoning to choose and interpret units and scales in formulas, graphs, and data displays CC.2.1.HS.F.4 Use units as a way to understand problems and to guide the solution of multi‐step problems. CC.2.2.8.B.2 Understand the connections between proportional relationships, lines, and linear equations. CC.2.2.8.C.1 Define, evaluate, and compare functions. CC.2.2.8.C.2 Use concepts of functions to model relationships between quantities. CC.2.2.HS.C.2 Graph and analyze functions and use their properties to make connections between the different representations. CC.2.2.HS.C.3 Write functions or sequences that model relationships between two quantities. CC.2.2.HS.C.6 Interpret functions in terms of the situations they model. Graph and analyze functions and use their properties to make connections between the different representations. CC.2.2.HS.C.3 Write functions or sequences that model relationships between two quantities. CC.2.2.HS.C.5 Construct and compare linear, quadratic, and exponential models to solve problems. CC.2.2.HS.C.6 Interpret functions in terms of the situations they model. CC.2.4.HS.B.1 Summarize, represent, and interpret data on a single count or measurement variable. Science
Anchor Descriptor
Core Standard
A1.1.2.1 Write, solve and /or graph linear equations using various methods
CC.2.1.HS.F3 Apply quantitative reasoning to choose and interpret units and scales in formulas, graphs and data displays
A1.2.1.1 Analyze and/or use patterns or relations.
CC.2.2.8.C.1
A1.2.1.2 Interpret and/or use linear functions and their equations, graphs, or tables
CC.2.1.HS.F.3
A1.2.2.1 Describe, compute, and/or use the rate of change (slope) of a line.
CC.2.2.HS.C.2
Anchor Descriptor
Core Standard
Science & Technology
Conduct multiple step experiments
Apply appropriate tools, materials and processes to solve complex problems