
How can teachers make statistics understandable and interesting for kindergarten students? The objective of the curriculum unit, “The Plot Thickens: Teaching Statistics Using Math Games,” is three fold: to examine the importance of teaching statistics in a kindergarten classroom, to provide an analysis of how kindergarten students learn math and to explore the implications of using games to teach statistical information. My unit will concentrate on math games that use everyday, real-world situations that play with data to teach core statistical concepts. The students will collect, organize, and display data using concrete objects, surveys, charts, and graphs.
In alignment with the National College-Career Ready Common Core Standards and the Pennsylvania Academic Standards, this unit will provide a literature-rich based program for teaching concepts in basic statistics to students in a full day, self-contained kindergarten classroom. The unit can be introduced at anytime throughout the academic year as there are many opportunities to play with mathematical ideas regardless of students various abilities or performance levels. The unit is essentially the development of a “data box,” consisting of center activities, clip boards for surveys, individual journals for writing and recording results, spinners, and dice for small group center experiences, whole group instruction, or individualized activities. Each lesson begins with a read-aloud from a popular picture book and the activities are based on each story.
There are five lessons. The first lesson explores children’s collections and an introductory model to display such data. The second activity demonstrates the art of taking and giving surveys based on a story called, Guess Who My Favorite Person Is by Byrd Baylor. The next lesson provides an opportunity to examine probability by playing a basketball game. What are the chances of making the basket from various points on a number line? Activity four is a clothesline display of paper doll clothes in order to graph the number of family members for each student. The last activity is the creation of a classroom mural by following a grid using rows and columns.
How can teachers make statistics understandable and interesting for kindergarten students? Mathematics is meaningful to children when it is varied, rich, and rooted in real-world problems and applications. (Thomas et al., 2006). Statistics are the collection of real-life experiences that children bring into play to make sense of their world such as a rock collection or rules of a favorite playground game. A growing body of research is revealing the potential benefits of using games in the classroom to strengthen the mathematics skills of children, particularly those from disadvantaged backgrounds. Research for this unit includes the following: (1) an examination of inequality in mathematical achievement in the United States educational system with an emphasis on stereotype threat, (2) the merits of an early introduction to statistics, (3) an analysis of how kindergarten students learn mathematics and lastly, (4) the implications of using games to teach data. The dangers of stereotype threat and negative self-assessment in math performance An individual’s perceptions of their ability in a given arena dramatically influence his or her actual performance (for review: Aronson, 2004). This is shown to be especially true in mathematical instruction and testing (Wheeler and Petty, 2001). When girls are told that boys typically do better on a test before they take it, they do significantly worse on the exam than a control group of girls who were not told this (Steele, 1997). Similar studies have been done using race (Steele and Aronson, 1995). Compounding the problem, a teacher’s expectations also influence the performance of his or her students (Rosenthal, 2002; Weinstein, 2002; Helwig et al. 2001) and this can further widen a male-female or black-white achievement gap (Ferguson, 1998; Bennett et al., 1993). As such, it is first and foremost, the work of teachers to fight this phenomenon and counter the belief that the only ones for whom math “comes easy” are white males.[1] In the United States, everyone has a fundamental right to an education, and truly our democracy depends on it. Yet, the US educational system is failing to ensure equal access for all to the essential problem-solving and reasoning skills that are necessary to succeed (Schmidt and Burroughs, 2013). As such, we need strategies to combat these inequalities, and I firmly believe that early intervention is the key to success. If children believe in their own competency from an early age, with support from their teachers, achievement gaps may disappear among these groups. If we take a wider, more global view, closing these gaps may also halt American students from falling behind those of other countries.[2] Below is a sample curriculum to introduce the concepts of statistics with a focus on kindergarten instruction. The Importance of an early introduction to statistics Learning math concepts through instruction, discovery, and directed play experiences now are considered the standard in kindergarten classrooms. In fact, studies show that children have the innate ability to learn basic mathematics skills throughout the first few months of life (Lee & Ginsburg, 2009). These skills strengthen as children grow and explore their surrounding environments. By the time children enter kindergarten, many are aware of numbers, shapes, and patterns and have the ability to problem solve. “Young children are capable of learning mathematics because many of these relationships and concepts are directly observable in the natural learning environment” (Linder et al., 2011). What better time to introduce statistics? Many teachers, however, find it intimidating to teach statistics, especially to younger children. According to Du Feu (n.d), “statistics is unclean, messy, and fraught with problems.” Despite the fact that statistical concepts may be difficult to comprehend, students can benefit tremendously from an early introduction to probability and data analysis. Whereas teaching statistics in primary grades has been proven advantageous to young students, it nearly is impossible to separate mathematics and statistics in early childhood classrooms (Pereira-Mendoza, n.d). Rather than separate the two entities, early childhood educators are encouraged to integrate statistics into other content areas and promote learning by providing interesting, enjoyable, and relatable experiences. Children are more likely to engage in and understand statistics when taught in an integrated approach in the classroom. While many mathematical concepts are beneficial to kindergarten students, statistics are important for a variety of reasons. Statistics are the study of information, otherwise defined as data (Taylor, 2012). The introduction to statistics allows students to integrate problematic thinking and other mathematical concepts into other content areas, as well as to apply mathematical skills to real life situations and concrete examples. In kindergarten, children engage in the collection of data, organization, and display of data via graphs, as well as probability problems on a regular basis. Students predict the weather, chart and tally information, and determine what is “most likely to happen” in a given situation. Although students at the age of five will not formally learn the linguistics of statistics until the upper grades, it is important that students are introduced to some of the vocabulary and understand the importance of collecting, analyzing, and predicting data. Probability is a concept within the field of statistics that already is introduced and explored in kindergarten classrooms. According to Rouse (2005), “Probability is a branch of mathematics that deals with calculating the likelihood of a given event’s occurrence, which is expressed as a number between zero and one.” Determining the probability of a particular event is something that students will use frequently as they advance in school. Moreover, probabilistic thinking is used in everyday experiences, both in and out of educational settings. It is well documented that young children use probabilistic thinking in a variety of ways including playing games, playing with dice, or choosing a toy (Tatsis, Kafoussi, & Skoumpordi, 2008). Children encounter probabilistic situations frequently, through play, working with peers, as well as instruction. Understanding and analyzing data is done on a daily basis in real world situations. It is something one does whenever there is the possibility of more than one outcome in a given situation. If students are exposed to statistics, data, and probability at a young age, the language of statistics will come naturally. Moreover, when implemented in the curriculum, the study of statistics will promote levels of math proficiency in later years. According to Tatsis et al., (2008), children are not only expected to develop an awareness of probability at a young age, but they also much lean to verbally express their opinions and justify the reasoning behind a conclusion. Thus, young children are more than ready to learn stimulating and challenging mathematics. An analysis of how kindergarten students learn mathematics Ways of integrating mathematical concepts with stories and with the world around us are not always obvious, especially to those of us who were taught mathematics as anything but integrated. Understanding how children in kindergarten learn, however, is crucial for teachers to understand in order to help students with mathematical proficiency. A young child does not take in information and learn new concepts in the same way as a student in middle or high school. Worksheets, quizzes and tests would not be beneficial in a kindergarten classroom. To achieve instructional goals in statistics, young children need problems to solve and the means to construct their own strategies (Stipeck, Shoenfeld, & Gomby, 2012). Students in kindergarten classrooms learn most effectively when a variety of instructional tools are used, when they are engaged in cooperative learning, and when they are given opportunities to learn through play. Learning for young students occurs within the natural context of play, especially when facilitated by a caring, unobtrusive adult figure (Thomas, Warren, & deVries). “In order to provide a high quality math education for young children, educators should consider possible factors that may influence children’s mathematical growth” (Thomas et al., 2006). The learning environment itself is a significant factor that influences growth across content areas, especially mathematics. For that reason, it is critical that educators design the environment in such a way that will motivate students to learn and that encourages their intellectual development. A well designed classroom should feature a variety of materials, such as games, blocks, templates and other concrete objects that will stimulate students’ senses and invite hands-on exploration. Further, materials should be available that accommodate different levels of student ability. Indeed, teachers should be mindful that their instructional environments do not limit any child’s access to challenging mathematics instruction (Thomas et al., 2006). Finally, the classroom design must be organized, inviting, safe, and comfortable. Engaging students in meaningful classroom discussions can positively influence mathematical growth. Therefore, teachers should use small group assignments to facilitate discussion. In effective classroom discussion, students share their ideas and solutions and respond to the findings of other student. In order for all students to participate, students should feel comfortable enough to ask questions, justify their findings, and make mistakes (Thomas et al., 2006), and this can be achieved by breaking classes into small groups or centers. Grouping students allows students of different abilities and points of view without the anxiety of sharing thoughts with the entire class. Moreover, teachers should use developmentally appropriate mathematical tasks. According to Thomas et al., (2006), “[m]eaningful tasks can increase motivations for learning new concepts, allow connections to be made with other mathematical ideas, and allow students to apply concepts to real-world applications.” When young children make connections between new concepts and prior information, they are more likely to understand and to retain the information. Children have varied ability levels and interests, and therefore, teacher should design mathematical tasks to challenge all students and keep them actively engaged. Educators can do this by employing a variety of tools, manipulatives, and games within the learning environment and by incorporating computers, calculators, smart boards, pictures, models, oral presentations, and dramatizations (Thomas et al., 2006). Concrete objects are one of the most effective ways to teach mathematics to kindergarten students. Historical influences in the field of Early Childhood such as Montessori, Plato, and Froebel all believed that mathematics was most successful when introduced through objects (Thomas et al., 2006). Hands-on opportunities help young students make the connection between the object and the abstract mathematical concept being taught. Aside from concrete objects, teachers also should be aware that there are numerous ways of integrating mathematical concepts with other content areas. Mathematical instruction can occur while reading a story, taking a walk, engaging in a morning meeting, or participating in a social studies lesson. When mathematics is integrated throughout the entire curriculum, a high degree of mathematical competency for young children is promoted (Thomas et al., 2006). Kindergarten students acquire new knowledge in a variety of different ways; however, the majority of learning for young students takes place as they interact in new experiences throughout the first years of life. According to Charlesworth and Leali (2012), “[c]hildren acquire concepts through three types of learning experiences: naturalistic, informal, and adult guided.” Naturalistic experiences occur when a child is completely in control of the specific experience. In regard to statistics, a naturalistic experience occurs when a student must collect and analyze data without specific instruction from the teacher. Informal experiences occur when an adult encourages the child to think about the concept and reinforce or expand the experience further (Charlesworth & Leali, 2012). For example, after a student collects data or determines the probability of an event, the teacher may ask the student questions in which they give an explanation for their findings. In adult guided learning, experiences are planned by the teacher or professional and guided by instruction (Charlesworth & Leali, 2012). Through guided instruction, teachers introduce new statistical concepts to the students before providing games, manipulatives and other tools for further understanding. The implications of using games to teach data Throughout time, humans have invented games. Indeed, culture is connected to mathematics by the very games in which children living in the same community participate. Educators must recognize the fundamental value of utilizing this relationship to further enhance mathematical instruction in the kindergarten classroom. To introduce statistics in kindergarten, the use of games that facilitate play is essential for teachers as well as students. Piaget stressed the importance of children learning through interaction and cooperation with others as they created and resolved different conflicts (Perry and Dockett, 2001). Through play, children have the opportunity to obtain a higher sense of understanding than they would have on their own. Playing games create positive experiences in all content areas. Furthermore, research has concluded that play is extremely effective and beneficial for young children learning new mathematical concepts (Perry & Dockett, 2001). When activities are fun and engaging, students are happy to participate and remember the subject matter. When students are engaged in a game, they are focused. Studies show a correlation between positive attitudes and higher achievement levels in national assessments (Nisbet & Williams, 2009). In addition, studies demonstrate that the use of games in education is beneficial for students of all ages. Concepts considered difficult for some students may become easier to master when games are implemented in the curriculum. New concepts have the potential to be exciting and desirable. In some cases, students are unaware that they are learning as they play new games with their classmates. Unsurprisingly, games are an effective tool to teach new mathematical skills, including statistics. According to Adama (n.d), “[g]ames provide a way of taking drudgery out of practicing new skills. In terms of gains in test results, research indicates that games are an effective way to retrain and reinforce children’s skills.” Learning occurs when there is a clear purpose. Children do not actively play to learn; rather, they engage in play to have fun. Games are effective, fun, and promote a positive attitude towards mathematical concepts and play is most beneficial when it is symbolic, meaningful, active, pleasurable, voluntary, rule-governed, and episodic. When an activity is enjoyed, children persevere. When games are played in the classroom, the students take a great deal of responsibility for their activity. When faced with a challenge or problem, students must use strategies and collaborate with others in order to come up with a solution to their problem. The intrinsic effects of using games to reinforce concepts of data and analysis have been researched in recent years. Using games in kindergarten classrooms meet mathematical standards, offer multiple assessment opportunities, help to achieve higher grades and report card markings, and are particularly beneficial for diverse learners (Adama, n.d). Additionally, games are easy to prepare, encourage strategic thinking, promote mathematical communication, and can be varied for extended use and differentiated instruction (Adama, n.d). Different types of games and strategic situations promote the development of new skills. Students can play games independently, with a partner or small group, or as a class. Students can play games that incorporate concrete objects, have few rules, or are guided by the teacher. Finally, using math centers is also effective because students have the ability to choose the game, the participants, and the ability level. These centers also allow teachers to observe all students and assess them appropriately. Statistics and probability are visible in all facets of our lives and the need to keep up in this ever changing world is of the utmost urgency. With recent pushes for higher math proficiency levels, teachers, administrators and other personnel have an obligation to reevaluate our math standards and introduce new concepts to younger children. Mathematics can be integrated across the curriculum, and concepts can be mastered in a variety of different ways. Through the use of games and incorporating play, statistics will no longer be seen as a daunting task but instead will be viewed as a concept that children enjoy, apply to real-life situations, and comprehend in a kindergarten classroom. [1] It may be interesting to note, however, that even groups who carry no historical stigma of inferiority can be impaired if one arranges a particular situation to their disadvantage. Aronson and colleagues found that white male engineering students with records of academic excellence performed significantly worse on a difficult math test after they were informed that their performance would help the researchers understand Asians’ mathematical superiority (Aronson et al., 1999). Truly, stereotype threat is a dramatic and fluid reality. [2] A 2009 study found that U.S. students ranked 25th among 34 countries in math and science, behind nations like China, Singapore, South Korea, Hong Kong and Finland (OECD).
In alignment with the National College-Career Ready Common Core Standards and the Pennsylvania Academic Standards, this unit will provide a literature-rich based program for teaching concepts in basic statistics to students in a full day, self-contained kindergarten classroom. The unit can be introduced at anytime throughout the academic year as there are many opportunities to play with mathematical ideas regardless of students various abilities or performance levels. The objectives for classroom activities are to gather, organize and display data on a bar graph and/or pictograph independently, collect statistics via surveys in response to questions posed to students through stories or daily classroom routines, arrange and display objects by one or more attributes, and provide practice for students for elucidation of organizing data. Moreover, students will be able to compare groups of one to ten objects to determine more or less and answer questions based on figures shown on graphs or charts. Students will be able to draw conclusions about information, predict the probability of an event and predict the outcome of events, and complete a simple graph to make selection with little or no assistance. The objective of the culminating activity is to create a mural using a square grid of student drawings that once pieced together will create a character.
In order to incorporate the Pennsylvania Math Standards and integrate the objectives listed, strategies will include ways to reinforce, enrich and extend children’s mathematical experiences, with an emphasis on integrating all aspects of the classroom. My intention is to create a “data box,” consisting of center activities, clip boards for surveys, individual journals for writing and recording results, game boards, spinners, and dice for small group center experiences, whole group instruction, or individualized activities. Typically, a lesson is introduced in kindergarten with a story or a picture book being shared with the group. Preceding the story, questions are asked to activate prior knowledge or experiences, and there are also follow-up questions about understanding of the story and to segue into the math activity. This approach engages students in high levels of response which focus attention on the relevant features of the concept being taught. Similarly, there are opportunities to play with mathematical ideas and to open new areas of interest to collect data and look for patterns. These patterns help the students to predict outcomes and possible solutions. There are investigations for collecting and analyzing data in many picture books that provide an opportunity to talk and think mathematically without destroying the story. Other strategies include modeling the activity or game for concepts, rules, or procedures. This is tremendously valuable in virtually each and every one of the lessons taught in a kindergarten classroom. Some of the lessons will be incorporated into the instructional daily routine such as calendar, weather, attendance, etc. After all, Statistics is based on real-life experiences.
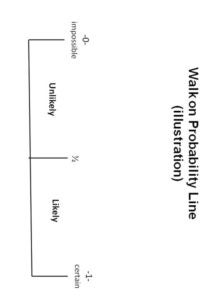
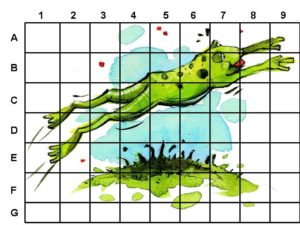
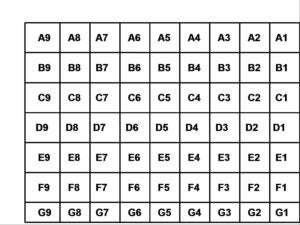
Lesson One Introduction to the Unit: Data Gathering and Analyzing Objectives Students will be able to: . Materials When This Box is Full by Patricia Lillie, graphic organizer, crayons, pencils Activity Create a math corner in the classroom equipped with a small bookshelf or bins containing items such as clipboards, crayons, markers, dice, spinners and paper and a bulletin board to display children’s work. Display the books that will be read before each lesson. As an introduction to the unit, invite the students to sit in front of the display and give details about the math corner. Select a book from the display and read the title. Explain to students that as each picture book is read, an activity will follow. Read the book, When this Box is Full by Patricia Lillie. The story is about a child that looks at an empty box and imagines all the things she will put in it through the coming year and as each month unfolds. After reading, explain to the class that when we collect and sort things, we are gathering and analyzing data. After asking the students what kinds of objects were placed in the box, brainstorm ways in which the objects from the story can be categorized. Make a class chart listing the categories as the students provide answers. Have children think of something they would like to collect. Distribute the graphic organizer worksheets. The students will return to their seats and draw and label their collections in the graphic organizer. Students will write two sentences to describe their collections. As a follow-up activity, ask students to bring in items they have collected around their house that they find interesting. Once they have established a collection of objects, ask them to sort the objects with a rule of their choosing and to describe that rule to a partner. Ask questions such as; “What can you tell me about your sorts? How does each set compare to each other?” Once the students have completed this task, help them to make a picture graph to represent their collection. Lesson Two Survey Says, But I Say… Objectives Students will be able to: Materials Clipboards, pencils, survey sheets (categorized for specific story literacy objectives), timer Activity Read the picture book, “Guess Who My Favorite Person Is” by Byrd Baylor. The story is about a girl playing a game called “tell-what-your-favorite thing-is.” Stop at various parts of the story to ask how individual students would answer some of the questions. At the end of the story, explain that when we conduct surveys and draw conclusions from them, we are gathering and analyzing data. Conduct a survey of student answers to the story’s questions, and see whether there are any patterns by which the answers can be categorized by making a class chart. Distribute a survey from the girl’s game in the story to each child. It’s okay if four or five students have the same survey questions. Allow them to mingle around the classroom for ten to fifteen minutes collecting answers from their classmates. Next, the students will return to their seats and write totals from each category in the survey. Finally, students will return to the carpet with their completed survey. Allow students to share their findings with the rest of the class. For the objective of this lesson, the surveys will include some of the questions from the story. The questions are: What is your favorite color blue? What is your favorite time of day? What is your favorite thing to touch? What is your favorite thing to smell? Do you dream? However, throughout the year, encourage the students to create their own surveys during centers time by including a survey box equipped with clipboards, paper, markers, and pencils. Moreover, laminate a few surveys and have them available on clipboards with dry erase markers. Use as a center directed activity in the classroom. Lesson Three What are the Chances? Objectives Students will be able to: Materials “Tuesday” by David Wiesner, a long ribbon, kid- size basketball, basket or net, Three 9” or 12” cards with the following titles: 1- CERTAIN, 0- IMPOSSIBLE, UNLIKELY, LIKELY and ½., chalk (if playing outside in the recess yard), sticky dots, data recording sheet Activity Begin the lesson by reading the story, Tuesday by David Wiesner. It is a Caldecott award winner book which begins with frogs relaxing on lily pads and then slowly levitating. They fly all Tuesday night through homes and yards and then as dawn approaches, fly lower and lower until they are back in their pond. Perplexed police and investigators wonder about the lily pads left behind. Discuss the chances of that actually happening. Introduce the term, “Probability” to the group and discuss its meaning. Probability can be defined as the chance of an event occurring. Ask students to name instances that they have heard the term used in their everyday lives. Guide the students to understand and use words such as likely, unlikely, and impossible. Show students the cards and discuss the chances of certain events for each vocabulary word. For example, if the lesson is done in May, ask what the chances are that it will snow or rain today, if it is a bright, sunny day with no clouds in the sky. Facilitate a discussion about why it is unlikely it will snow. Explain to the students that in the next activity, they will be looking at the chances of something happening in a basketball game. Explain that they are performing an “experiment” and will need to record what happens during the game. Tell them that good scientists keep track of data or the things that happen during an experiment. Scientists also record how many times things happen in an experiment. Show the students a toy basketball hoop and ball. (A laundry basket and a plastic ball will do if they are unavailable) Ask them to describe their chances of making a basket on the first try from a distance of 10 feet. Tell the class probability can be expressed on a probability scale. Place the ribbon on the floor representing the scale. Place “0 Impossible” next to the end farthest from the net, “1 Certain” next to the ribbon closet to the net, and “1/2” by the center of the ribbon. Place the “unlikely” card between “0” and “½” and the” likely” card between “½ “and “certain” along the ribbon scale. Discuss the reasons for placement. Ask students to name the place where they think they will make a basket. Line the students at the end of the ribbon. Have each student throw the ball until he/she makes it, moving closer up the scale. The student will place a dot where he/she made the basket. When all students have completed the game by scoring a basket, distribute the recording sheets. Students will count and record the total dots for each term on the walk-on probability scale. End the activity with a discussion. Was the outcome in line with their predictions? Lesson Four Clothesline Graph Objectives Students will be able to: Materials The Relatives Came by Cynthia Rylant, clothesline or bungee cord with clothespins and hung at children’s height for easy access, sentence strips, colorful scrap paper or wallpaper samples, markers, crayons and pencils, stencils of paper doll clothes cutouts of various sizes, scissors, graph worksheet Activity Begin the lesson by reading the picture book, The Relatives Came by Cynthia Rylant. This is a story about a family reunion where the relatives arrived from far away and stayed for days with many humorous antics. The story provides many opportunities for data gathering and analyzing. Discuss the different types of relatives in a family, as well as the fact that some families do not have two grandparents, or uncles, etc. Make a class chart of the relatives in the story. Distribute a bar graph worksheet to each student. (See appendix) The students will complete a graph to illustrate their own family. When students finish their graph, analyze the information collected on each graph. How many brothers and sisters do you have? How many Aunts or cousins? Explain that the clothesline in the room will display everyone’s data taken from each graph. On the clothesline hang labeled sentence strips to divide each type of relative such as brother, sister, aunt, uncle, grandmother, grandfather, mom and dad. On each table, place stencils (or paper with various articles of clothing) of clothing, colorful paper, scissors, pencils and crayons. The students can trace and cut a shirt or pants to represent each member in their family. Each child can use the clothespins to hang their clothing on the line in the appropriate place. When the activity is finished, a colorful representation of the total number of family members for the entire class will be on display. The children can takes turns counting the data to find the total number in each category. Lesson Five Who’s On My Grid? Objectives Students will be able to: Materials Jump, Frog, Jump! by Robert Kalan, two game spinners; one with numbers 1-9, one with letters a-g, papers with a letter-number combination on one side and a part of a mural picture on the other, large poster size grid on the wall with letters A through G for the rows and numbers 1-9 for the columns. (enlarge and make two copies of the grid at any office supply store , then cut the grid into squares for the game) , sticky putty (for adhesion) (see Appendix) Activity This activity can be played in small groups during center time with a different poster grid on the wall for each center. Begin the lesson by reading the story, Jump, Frog, Jump! by Robert Kalan. It is a story about a frog that catches a fly and escapes from a fish, a snake, a turtle, and more. Each new event becomes part of the story. Gather information about the animals in the story to create a food chain. Make a class chart to categorize the food chain of the animals in the story. Next, display the grid on the wall and point out the letters and the numbers. Explain that the letters are the rows in the grid and the numbers are the columns. Tell the students that they will create a “mystery character” from the story by playing a game using two spinners and the grid. Show how to use a spinner is to identify a letter or row. Next, spin the number spinner to identify the number or column. Model how to locate the paper from the box that has both the letter and the number on the back. Find the row on the wall and then the column and using a piece of putty, stick the paper in the correct position on the square grid. The students will then take turns in a small group to spin both spinners and locate the position of the paper on the grid. If a player spins a letter-number combination that has already been used, they lose a turn and the next player continues. The game is over when all the squares are placed on the wall to reveal the story character.
Adama, B. (n.d.). Math games and activities . Retrieved March 28, 2012, from Math games and activities: http://www.mathgamesandactivities.com/tag/benefits-of-math-games/ This was an interesting article that examined the many benefits of math games and activities in the classroom. Aronson, J., Lustina, M. J., Good, C., Keough, K., Steele, C. M., & Brown, J. (1999). When White Men Can’t Do Math:Necessary and Sufficient Factors in Stereotype Threat. Journal of Experimental Social Psychology, 35, 29–46. Aronson, Joshua. The Threat of Stereotype. November 2004 | Volume 62 | Number 3 Closing Achievement Gaps Pages 14-19. Bennett, Randy E , Gottesman, Ruth L., Rock, Donald A., Cerullo, Frances (1993). Influence of Behavior Perceptions and Gender on Teachers’ Judgments of Students’ Academic Skill. Journal of Educational Psychology 85: 2, 347-356. Chard, D., Baker, S., Clarke, B., Jungjohann, K., Davis, K., & Smolkowski, K. (2008). Preventing early mathematics difficulties: The feasibility of a rigorous kindergarten mathematics curriculum. Learning Disability Quarterly, 11-20. This article reviewed common difficulties in the kindergarten mathematics curriculum and how teachers can prevent these difficulties from occurring. Charlesworth, R., & Leali, S. (2012). Using problem solving to assess young children’s mathematical knowledge. Early Childhood Educational Journal, 373-382. This article reviewed studies finding how young children develop problem solving skills through play. Clements, D.H., Sarama,J., & DiBiase, A.-M.(Eds.).(2004) Engaging young children in Mathematics: Standards for Early Childhood Mathematics Education. Mahwah, NJ: Eribaum Du Feu, C. (2007). Seeing the woods- statistics for the very young. Education- Significance Magazine, 142-144. This was an interesting article published by a teacher that wrote of his experience using statistics with his young students. Ferguson, R. F. (1998). Teacher’s Perceptions and Expectations and the Black-White Test Score Gap. In C. Jencks & M. Phillips (Eds.), The Blackwhite test Score Gap. Washington, DC: Brookings Institution Press. Ginsburg, H.P. 1989. Children’s arithmetic: How they learn it and how you teach it. Austin, TX: Pro-ed. Harris, Judith Rich. The Nurture Assumption: Why Children Turn Out the Way They Do. Free press, 2011. Helwig, Robert, Lisbeth Anderson, and Gerald Tindal. “Influence of Elementary Student Gender on Teachers’ Perceptions of Mathematics Achievement.” The journal of educational research 95.2 (2001): 93-102. Lee, J., & Ginsburg, H. (2009). Early childhood teachers’ misconceptions about mathematics education for young children in the United States. Australian Journal of Early Childhood, 37-45. This article spoke of the common misconceptions held by early childhood professionals regarding the instruction of mathematics. Leland S. Cogan, William H. Schmidt, and David E. Wiley, “Who Takes What Math and in Which Track? Using TIMSS to Characterize U.S. Students’ Eighth-Grade Mathematics Learning Opportunities,” Educational Evaluation and Policy Analysis 23, no. 4 (2001) 323-341. Linder, S., Powers-Costello, B., & Stegelin, D. (2011). Mathematics in early childhood: Research- based rationale and practical strategies. Early Childhood Education Journal, 29-37. Early Childhood Education Journal provided this powerful article giving teachers strategies to effectively teach mathematics to young students. Nisbet, S., & Williams, A. (2009). Improving students’ attitudes to chance with games and activities . The Australian Mathematics Teacher , 25-37. This article was written to explain how to effectively use games to help students understand the concept of probability. Organization for Economic Co-operation and Development (OECD). 2009. http://www.oecd.org/pisa/pisaproducts/pisa2009/pisa2009keyfindings.htm Petsche, J. (2011). Engage and excite students with educational games . Knowledge Quest, 42-44. Petsche wrote this article to provide insight on the use and benefits of educational games in the classroom. School Library Journal Staff. (2011, August 23). U.S students rank 32 in math proficiency, 17 in reading study says. Retrieved March 25, 2013, from School Library Journal: http://www.schoollibraryjournal.com/slj/home/891733-312/u.s_students_rank_32_in.csp This article was extremely interesting and examined math and reading proficiency levels in the United States. Rosenthal, R. (2002). The Pygmalion Effect and Its Mediating Mechanisms. In J. Aronson (Ed.), Improving Academic Achievement: Impact of Psychological Factors on Education. San Diego, CA: Academic Press. Rouse, M. (2005, December). Whatis.com. Retrieved March 26, 2013, from Probability: http://www.whatis.targettech.com/definition/probability This purpose of this article was to define probability and examine how it is applied to teaching statistics. Steele, C. M., & Aronson, J. (1995). Stereotype Threat and the Intellectual Test Performance of African Americans. Journal of Personality and Social Psychology, 69(5), 797–811. Steele, Claude M. “A threat in the air: How Stereotypes Shape Intellectual Identity and Performance.” American psychologist 52.6 (1997): 613. Stipek, D., Schoenfeld, A., & Gomby, D. (2012). Math matters, even for little kids . Education Week, 27-29. This article stressed the importance of mathematical instruction in early childhood education. Thomas, L., Warren, E., & deVries, E. (2011). Play-based learning and intentional teaching in early childhood contexts. Australasian Journal of Early Childhood, 69-75. This was a very informative article that emphasized the importance and benefits of play- based learning in education. U.S. Department of Education, National Center for Education Statistics, Entering Kindergarten: A Portrait of American Children When They Begin School: Findings from The Condition of Education 2000, Nicholas Zill and Jerry West, NCES 2001–035, Washington, DC: U.S. Government Printing Office, 2001 Varol, F., & Farran, D. (2006). Early Mathematical growth: How to support young children’s mathematical development. Early Childhood Education Journal, 381-386. This article was written to inform professionals on the best approaches to fostering mathematical development in early childhood education. Weinstein, R. S. (2002). Reaching Higher: The Power of Expectations in Schooling. Cambridge, MA: Harvard University Press. Wheeler, S. Christian, and Richard E. Petty. “The Effects of Stereotype Activation on Behavior: A Review of Possible Mechanisms.” Psychological bulletin127.6 (2001):797. Teacher Resources Navigating through Data Analysis and Probability in Prekindergarten through Grade 2– available from NCTM. Contains additional lessons for data analysis activities. Picture Books for Data Gathering and Analyzing Baylor, Byrd. Guess Who My Favorite Person Is. Illustrated by Robert Andrew Parker. Simon and Schuster, 1992. ISBN 0-684-19514-3 The narrator joins a girl in her game called “tell-what-your-favorite-thing-is.” Playing the game can become a data gathering and analyzing activity about everyone’s favorite things. Brown, Ruth. The Picnic. Dutton, 1993. ISBN 0-525-45012-2 Kalan, Robert. Jump, Frog, Jump! Illustrated by Byron Barton. Morrow, 1981. ISBN 0-688-09241-1 This cumulative tale starts with a fly and ends with a frog nearly being caught by some boys. Each new event becomes part of the repeated pattern. Lillie, Patricia. When This Box is Full. Illustrated by Donald Crews. Morrow. 1993. ISNB 0-688-12017-2 Each month the young girl puts new items in the box. Rylant, Cynthia. The Relatives Came. Illustrated by Stephen Gammel. Simon and Schuster, 1986. ISBN 0-02-777210-1 This is an old-fashioned family reunion where the relatives come from far away and stay for days, giving us ample opportunity to view them and their antics. Wiesner, David. Tuesday. Houghton, 1991. ISBN 0-395-55113-7 Frogs flying on lily pads invade the village during the night. Police and other investigators find no evidence, except lily pads all over the place.
A human family goes on a picnic, and we see the events from the point of view of the animals they unwittingly frighten and disturb. The family dog is the main threat to the animals. Take surveys on people’s opinions about dogs.
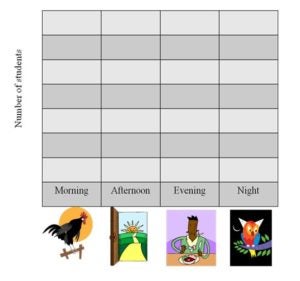
Appendix 1: Handout for Lesson One Name: ________________________________________ Date: _________________ Write the name of your collection in the middle box, and draw pictures of ways in which you could sort your collection in each of the other boxes. Appendix 2: Handout for Lesson Two Name: ________________________________________ Date: _________________ What is your favorite color blue? Put a tally mark next to the answer. Do you dream? Put an X in the box above the answers. What’s your favorite time of day? Color a square for each answer Appendix 3: Handout for Lesson Three Appendix 4: Handout for Lesson Four Name: ________________________________________ Date: _________________ Appendix 5: Handout for Lesson Five Figure 1: Front of grid. Figure 2: Back of picture with labels.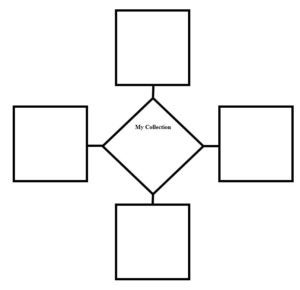
Sky Blue
Total:
Midnight Blue
Total:
Turquoise
Total:
Powder Blue
Total:
Royal blue
Total:

Total:
Total:
Yes
No
5
4
3
2
1
Brothers

Sisters
Grandparents

Aunts

Uncles

The Pennsylvania Learning Standards for Early Childhood Education: