
I have always felt it important to teach chemistry in an interdisciplinary manner that integrates learning from various disciplines. This has proven difficult at the high school level as we often teach science as a yearly progression of separate, unrelated courses each with little relationship to the others. As a result, many students have difficulty making deep, authentic connections
to the science content.
For this reason, I have always sought to find topics that would help connect my tenth-grade chemistry curriculum to my student’s prior year’s biology curriculum. One unit that has helped in this effort has been my unit on the types of chemical reactions. Relating the study of the chemistry of synthesis / combustion reactions and their effects on the environment to the biology of photosynthesis, cellular respiration, and climate change has provided a welcome opportunity to teach chemistry in a more holistic manner.
I have however, recently realized that this unit does not adequately explore the biology curriculum as I have never fully analyzed the mitochondria where cellular respiration occurs, or the various other forms of metabolism used by living organisms. A more rigorous analysis of the biochemistry of metabolic pathways and the way these processes affect the foods we eat, our environment, and our health would make the chemistry (and biology) content less abstract and more relevant to my student’s lives.
Another important theme that is missing in my chemistry curriculum is an understanding of the evolutionary history of cellular respiration and metabolism. Investigating the environmental conditions that influenced the evolution of mitochondria and the differing types of metabolism would give my chemistry curriculum this important historical perspective.
The goal of this unit is therefore to explore the evolutionary history of mitochondria and how they became an essential organelle within eukaryotic cells. A key focus will be on the biochemistry of aerobic, anaerobic, and fermentative metabolic pathways and the effects these differing types of metabolisms have on living organisms and our environment
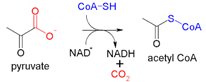
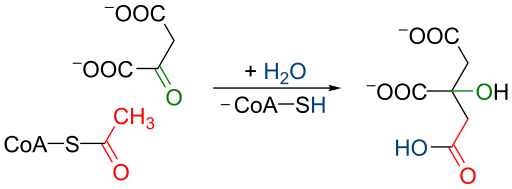
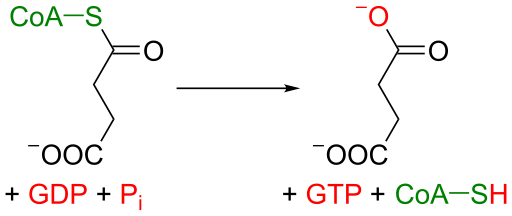
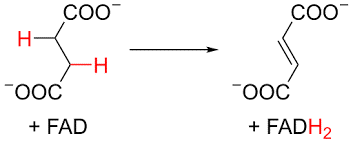
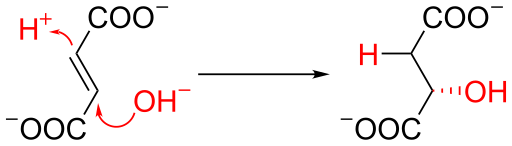
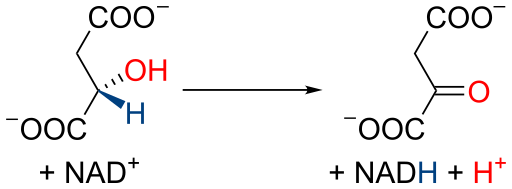
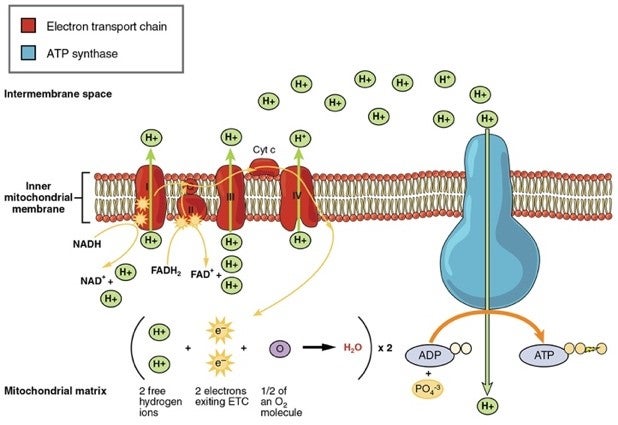
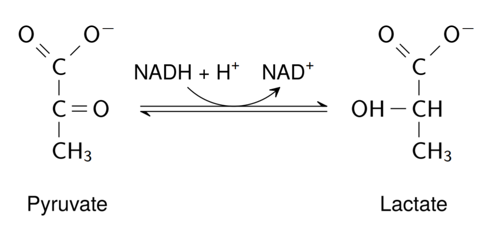
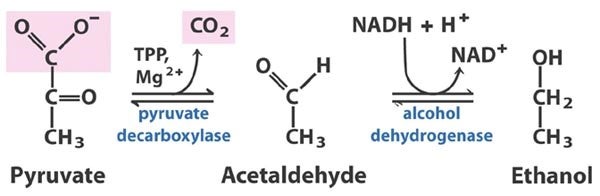
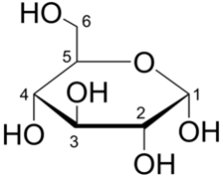
The teaching of evolution has become quite problematic in our nation’s schools. Given the views of the differing cultural and religious communities we serve, teachers have had to teach evolution as if it were a debatable construct that sound arguments could easily disprove. Students in our classes have often been told that they have the right to accept or reject our teaching on the subject because the concept of evolution is just a “theory”. Although I respect the differing positions on this matter, I feel that there can be no substantive argument against the concept of evolution if we view it from the perspective of evolutionary scientists. They (and most members of the scientific community) have historically defined evolution as “any change in the frequency of alleles within a population from one generation to the next” (Millstein, 2019). If we view evolution from this perspective, then we must acknowledge that any modification of an organism’s genome is an evolutionary event. Evolution therefore happens whenever a life begins or ceases to exist, it happens when an organism mutates, or goes extinct as each of these circumstances changes frequency of alleles in a population. In this sense, evolution has been occurring since life first emerged in the ancient seas and has continued for countless millennia. It cannot be considered a theory as there exists an indisputable body of geological, biological, and fossil evidence that chronicles the fact of the ongoing modification of the genomes that regulate life. The evolutionary history of life on Earth is the narrative of those modifications. An organism’s genome codes for the traits (behaviors, physiology, and biochemical processes) that allow it to adapt and thrive in its environment. When the organism reproduces it passes these adaptive traits to its offspring. Genomes are however seldom passed on in an exact form as modifications to the genetic code (mutations) are always occurring. The environment is also continually changing; thus, future survival depends on whether (or not) the organism’s traits remain adaptive within changing environmental conditions. In this way the environment (nature) exerts a selective pressure on a species as those organisms with adaptive traits can survive and successfully reproduce better than organisms with maladaptive traits. Survival will continue as long as the species is able to evolve new adaptive traits and pass them on to succeeding generations. This process, known as evolution by natural selection, is one of the mechanisms that acts to alter the frequency of alleles across generations. Natural Selection along with genetic mutation, migration, and genetic drift are the mechanisms that help explain how and why evolution occurs. Mutations are caused by a variety of (external and / or internal) processes that result in the creation, transformation or loss of existing alleles. Mutations are especially important as they are the source of new alleles which allow some organisms in a population to adapt to changing environmental conditions. It is important to note that many mutations are deleterious: others have no evolutionary consequence as only those mutations that increase the probability of successful reproduction contribute to the evolution of a species by natural selection (Gregory, 2009). Migration occurs when organisms leave a given geographical area (thus removing a certain number of alleles from the population) or when they enter a new area (thus adding alleles to an existing population). Genetic drift is a process where alleles disappear from a population, or one version of an allele becomes fixed. It is a statistically random process that reduces the diversity of alleles in a given population. These changes can be caused by a natural catastrophe that kills many individuals in a population leaving only a few survivors (the bottleneck effect) or when a small number of individuals are separated from the large population (the founder effect). Each of these events will cause some alleles to “drift” out of existence. Natural selection refers to the process in which the frequency of favorable adaptive traits increases from generation to generation. The increased frequency of alleles occurs primarily in response to the environment as only those organisms that can adapt can successfully reproduce and pass their traits to their offspring, Over time, beneficial traits will become increasingly prevalent in descendant populations by virtue of the fact that parents with those traits consistently leave more offspring than individuals lacking those traits…If this process happens to occur in a consistent direction——then there can be a gradual, generation-by-generation change in the proportion of traits in the population. (Gregory, 2009 pg. 161) These mechanisms have together contributed to the evolution of the expansive biodiversity of living organisms that inhabit our planet. Natural selection in particular helps explain the manner in which species are so precisely and uniquely adapted to their ecological niches. Research and scholarship by scientists from many differing fields have supplied evidence of the ongoing modification of genetic structures that have occurred as a result of these evolutionary mechanisms. The changes to the frequency of alleles across thousands of species they have documented provides concrete evidence of our evolution from a common ancestor. These are the perspectives on evolution that inform this unit. It is my hope that they will allay any possible discomforts with the concept and allow all students to fully engage with the history it explores. Looking across our planet’s four-and-a-half billion-year history, the rise of dioxygen—an interval sometimes called the Great Oxygenation Event (GOE)—is arguably the most important environmental change. This revolution occurred approximately 2.3 billion years ago, roughly at the mid-way point in Earth history, and it was ultimately driven by a biological innovation: the evolution of oxygenic photosynthesis (Fischer & Valentine, 2019) Life emerged at a time when the oceans were predominantly anoxic. Early life forms (Archaea and Bacteria) survived through anaerobic processes that used either light energy (anaerobic photosynthesis) or the energy in compounds such as hydrogen sulfide (chemosynthesis) to reduce inorganic carbon which provided the energy organisms needed to power their life functions. Although most organisms of the time were adapted to the anoxic environment, researchers believe that as early as 3.0 bya[1] cyanobacteria began using light and the oxidation of water to produce life sustaining energy (Rothschild, 2008). A byproduct of this early oxygenic photosynthesis was oxygen which began to accumulate in the oceans. Concentrations however, remained low as most of the oxygen was absorbed by buffering chemical reactions or trapped in metallic oxides and oceanic carbon sinks. Sometime between 2.4 and 2.3 bya (the start of the Great Oxygen Event), the equilibrium shifted and free oxygen concentrations began to rise to approximately 0.001% of present atmospheric levels (P.A.L.) (Lyons, Reinhard, & Planavsky, 2014). While oxygen levels rose dramatically at the onset of the event, levels remained well below current percentages for billions of years, until approximately 700-600 mya[2] when a second oxygenation increased concentration to levels near current values. In this view, this second O2 influx oxygenated much of the deep ocean while enriching the surface waters, thus welcoming the first animals and, soon after, their large sizes and complex ecologies above and within the sea floor (Lyons, Reinhard, & Planavsky, 2014, p.307) The change to an oxygenated atmosphere provided environmental advantages to those organisms capable of engaging in aerobic life processes, but it also placed great stress on organisms unable to withstand oxygen’s toxic effects. As a result, many species would perish, but eukaryotes with the aid of their specialized endosymbionts (the mitochondria) would thrive. Available data indicate that all eukaryotes studied to date possess either a mitochondrion or a hydrogenosome (an anaerobic form of mitochondria) or that they possessed such an organelle in their evolutionary past. (W. Martin, Hoffmeister, Rotte, & Henze, 2001 p, 1534) Mitochondria are considered the “powerhouse” of eukaryotic cells as they are the organelle that generates the bulk of the cell’s supply of ATP. All eukaryotes have either fully functioning mitochondria or vestiges of them in their genomes. There are, however, variations in their structures, the organisms they exist with, and their various metabolic pathways. Molecular sequencing of the mitochondrial genome in mammals, plants, and other animals has discovered an extensive variation in its size (ranging from 6kb (6000 base pair) in the malaria parasite to well over 11,000 kb in some land plants), coding mechanisms, organization, and metabolic pathways. Reconstructions of the phylogenetic trees based on sequencing data has pointed to the alpha class of bacteria (a – proteobacteria) as the source from which the lineages emanated (Gray, 2012). Mitochondria did not however, evolve from simple bacteria to their current form on their own, rather they evolved within eukaryotic host cells with which they merged through the process of endosymbiosis (Ettema, 2016) . Endosymbiosis, the joining of two differing organisms for mutual cooperation and benefit, was first considered by 19th century biologists attempting to classify organisms that seemed to be composed of two differing species (W. F. Martin, Garg, & Zimorski, 2015). Russian scientist Constantin Mereschkowsky was the first to publish a paper in 1905 that proposed the endosymbiotic theory in which some cells (plastids) arose as the result of the merging of two unlike organisms. Although Mereschkowsky’s theories were pursued by many European and American biologists, it was widely criticized and discredited by the scientific community. As a result, few evolutionary biologists considered it a plausible explanation for the evolution of organelles such as mitochondria or chloroplasts (. Interest in the theory was rekindled by the research of Lynn Sagan (later as Lynn Margulis) who began analyzing extranuclear DNA in plastids and mitochondria. Her 1967 paper “On the Origin of Mitosing Cells” proposed that plastids and mitochondria were the result of ancient symbiotic events. Her 1970 book, “Origin of Eukaryotic Cells” firmly established the plausibility of endosymbiotic theory (Archibald, 2015). In the ensuing years new techniques in genomic analysis would provide the first evidence supporting the theory. Continued improvements in genetic sequencing and research by molecular biologists around the world provided additional evidence to support Margulis’s thesis so that “By the mid-1980s it was clear that endosymbiosis was the only reasonable explanation for the data in hand” (ibid, p. R913). There are currently two competing hypotheses that attempt to explain the evolutionary history of mitochondria and their eukaryotic hosts: the Symbiogenesis hypothesis (known as the mitochondria early scenario) and the Archezoan hypothesis (the mitochondria late scenario). Each hypothesis accepts that the organisms merged through endosymbiosis, however the timing of the union as well as the nature of the host and symbiont has been a topic of intense discussion among evolutionary biologists for decades (Archibald, 2015). The symbiogenesis hypothesis suggests that an a proteobacteria (that would later become the mitochondria) was taken up by a primitive archaeal organism which then evolved the nucleus and other organizational features of eukaryotic cells. In this instance the complexity of the eukaryote (and that of the mitochondria) occurred after endosymbiosis. In the archezoan hypothesis, the host was a relatively complex archaeal cell that took in (through phagocytosis) the mitochondria and incorporated it into an already established cellular structure. In this instance complexity would have preceded endosymbiosis. It has been impossible to absolutely prove or disprove either of these hypotheses given the difficulty of analyzing and “correctly” interpreting geochemical and fossil evidence that is billions of years old. As such the assumptions that support each hypothesis have made each seem a plausible explanation of the evolutionary history of mitochondria and eukaryotes. However, recent scholarship and continued molecular research has substantially weakened the Archezoan hypothesis (W. Martin et al., 2001). Proponents of this evolutionary history base their assumptions on phylogenetic reconstructions that suggest that archezoa (parasitic anaerobic protists) were early eukaryotic lineages that diverged before the acquisition of mitochondria. These amitochondriates would have already evolved a nucleus and other complex cellular structures before endosymbiosis took place (Archibald, 2015). However, in recent years, more precise phylogenetic analyses and additional taxonomic data have shown that the proposed Archezoan taxa were incorrectly positioned and were not close to the base of the eukaryotic clade. In fact researchers note that “the current eukaryotic tree is more accurately characterized as a bush, with no one lineage clearly the earliest diverging (Gray, 2012 p.5). Additionally, molecular analysis of every existing eukaryotic lineage has discovered vestiges of mitochondria related organelles in all of their genomes. Thus, we currently know of no extant eukaryotic lineages that are convincingly amitochondrial and that therefore might have been primitively amitochondriate. This conclusion does not mean that such lineages do not exist. We may simply not have discovered them yet, or they may have existed at some point in evolutionary history and have now all become extinct. Nevertheless, rejection of the archezoa hypothesis on phylogenetic grounds coupled with the apparent absence of any known amitochondriate eukaryotic lineages considerably weakens the case for [the late] acquisition of mitochondria via the classical endosymbiont route (Ibid, p. 6). While the archezoan hypothesis suggests that mitochondria and eukaryotes evolved independent of each other, the symbiogenesis position is that the two organisms co-evolved. Adherents to this hypothesis believe that the host was likely an obligate anaerobic chemoautotroph that created its energy by using hydrogen to reduce inorganic carbon compounds. The symbiont however was a heterotrophic facultative anaerobe able to survive in either aerobic or anaerobic environments. Under anaerobic conditions it would use fermentative metabolism to generate ATP which produced the molecular hydrogen needed by its host, but under aerobic conditions it would be able to use oxygen to perform oxidative phosphorylation. Thus, the symbiont’s facultative ability would ensure the host’s continued survival in aerobic or anaerobic conditions. This type of symbiosis known as anaerobic syntropy currently exists between methanogens (obligate anaerobes that require hydrogen gas in the metabolism of carbon compounds), and their symbionts (usually a hydrogenosome) that produce molecular hydrogen as a waste product of their metabolism. The following equations illustrate the symbiotic reactions CO2 + H2 (g) à CH4 (g) + H2O (l) + ATP C6H12O6 à Acetate + H2 + CO2 The transition to an oxygenated biosphere and the resulting effect on the earth’s biogeochemical cycles, would create environmental conditions that determined the course of the newly formed organism’s evolution. Over time these selective pressures (along with the transfer of genes and enzymes from symbiont to host) would transform the primitive cell into the complex heterotrophic eukaryote that is the foundation for most of our higher life forms [3]. The mitochondrial symbiont also evolved into an indispensable intracellular organelle with specialized metabolic pathways that enable it to perform aerobic and / or anaerobic metabolism for a vast array of host organisms. In eukaryotes metabolism begins when glucose is taken into the cytosol where it produces 2 molecules of ATP and pyruvate during glycolysis: (The glycolytic pathway and each of the following metabolic pathways will be analyzed in a later section of this unit). Under aerobic conditions, pyruvate diffuses into the mitochondria where oxidative phosphorylation generates additional molecules of ATP. Under anaerobic conditions, several possible metabolic pathways are possible: in organisms with mitochondria (such as the hydrogenosomes) pyruvate is used in the mitochondria to generate ATP with molecular hydrogen, acetate and carbon dioxide as a by-product. Organisms without mitochondria (the mitosomes) recycle their pyruvate and continue to use glycolysis to generate ATP, with ethanol, carbon dioxide and acetate as by products. Organisms able to live in either oxic or anoxic environments (facultative anaerobes) can use aerobic pathways and / or fermentative (alcohol or lactic acid) metabolism to generate ATP. (W. Martin et al., 2001 p. 1531, figures 5 a, b, c, and d for visuals.), All living organisms require energy to survive. Autotrophic organisms are able to capture and store energy in compounds (usually carbohydrates) that are then cannibalized through a variety of metabolic processes. Chemosynthetic autotrophs thrive in anoxic environments through the action of redox reactions that capture the chemical energy in inorganic compounds (usually hydrogen sulfide, hydrogen gas, or methane) and store it in organic compounds. Photosynthetic autotrophs use redox reactions to capture solar energy and store it in monosaccharides (glucose, fructose, or galactose). Heterotrophs lack these abilities and must acquire energy by consuming and metabolizing the organic matter produced by autotrophs. Organisms in each of the three domains of life (Archaea, Bacteria, and Eukarya) have developed different metabolic pathways to release the energy stored within organic molecules. These metabolic pathways have developed in response to environmental conditions and available chemical resources. Heterotrophic eukaryotes satisfy their energy needs through oxidative metabolism that converts organic compounds (principally glucose) into molecules of ATP (adenosine triphosphate) which are used to power an organism’s life functions. In eukaryotes and many unicellular protists metabolism begins with a series of reactions (known as glycolysis) that produce ATP and the compounds (pyruvate and NADH). These compounds can be used in subsequent cycles of glycolytic metabolism, or they can be used in the process of oxidative phosphorylation within the cell’s mitochondria. It is important to note that glycolysis is an anaerobic process that occurs in the cell’s cytosol without the aid of the mitochondrial matrix. Thus, while nearly all organisms depend on glycolysis as the foundation of their metabolism, some do not require oxygen (anaerobes) or mitochondria (amitochondriate) to fulfill their energy requirements. The differing metabolic pathways depend on the cell’s environment (aerobic / anaerobic) and the structure of mitochondria within the organism. In mammals and plants, glycolysis is followed by a series of reactions (the Krebs cycle and electron transport chain) that take place within the mitochondrial matrix. The mitochondria in these organisms (aerobic mitochondriates) perform oxidative phosphorylation that uses oxygen as the terminal electron acceptor to produce approximately 32 -36 mole of ATP per mole of glucose. The byproducts of this process are carbon dioxide and water as shown in the familiar equation for cellular respiration: C6H12O6 (s) + O2 à CO2 (g) + H2O (g) + ATP Organisms living in anaerobic environments (invertebrate worms and some mollusks) also perform oxidative phosphorylation within their mitochondria but use compounds such as fumarate (or nitrate) as terminal acceptors of electrons. These (anaerobic mitochondriates) excrete succinate and acetate and are able to produce approximately 5 moles of ATP / mole of glucose (William Martin & Marek, 2010). Hydrogenosomes are a group of anaerobic mitochondriates that use fermentation to metabolize organic matter. The mitochondria in these organisms (trichomonads, some fungi and ciliates) lack an electron transport chain and are therefore able to generate only about 4 mole of ATP / mole glucose. The mitochondria within these organisms are known as hydrogenosomes because they excrete hydrogen as a waste product (Zimorski, Mentel, Tielens, & Martin, 2019). In recent years organisms (such as the intestinal parasite Giardia Lamblia) have been found to harbor the vestiges of mitochondria that are not used in metabolism. These anaerobic amitochondriate (classified as mitosomes) use enzymes in the cytosol to synthesize ATP (Van Der Giezen, 2009). Anaerobic metabolic pathways occur in all groups of eukaryotes. The byproducts of these metabolic pathways have a profound effect on our health, food sources, and our environment. We will explore these pathways at a later section of this unit. An analysis of metabolism necessarily begins with glycolysis as it the basis of aerobic and anaerobic metabolism. Glycolysis is the most ancient of metabolic processes occurring in nearly all eukaryotes (cite). It is the initial process in aerobic and most forms of anaerobic metabolism. Glycolysis begins when a phosphate group (PO32-) is added to a glucose molecule creating glucose-6 phosphate which requires the investment of one molecule of ATP. The reaction also decreases the intra cellular concentration of glucose and facilitates the diffusion of additional glucose into the cell. Glucose 6-phosphate isomerizes to fructose 6-phosphate, which is converted by a second phosphorylation into the 1-6 fructose bi phosphate molecule. This second phosphorylation requires the investment of a second ATP molecule. These molecules are illustrated in figures 1a through 1c. These phosphorylations are catalyzed by a series of enzymes (hexokinase and phosphofructokinase) which help regulate the rate of the metabolism of glucose. High levels of ATP in the cell will inhibit the action of the enzymes and slow glucose metabolism, lower rates will stimulate the enzymes and increase metabolism. These feedback mechanisms help regulate the rate of glucose metabolism during glycolysis. It is important to note that while glucose is the primary metabolite in the glycolytic pathway, it is not the only monosaccharide that can be metabolized. Fructose (primarily from fruits, honey, and plants) and galactose (primarily from dairy products) can also be used as sources of ATP. Fructose is a naturally occurring monosaccharide found in fruits and honey. It is also a component of the disaccharide sucrose which is composed of fructose and glucose. In the early1970 a more concentrated form of fructose (High Fructose Corn Syrup: HFCS) was introduced. HFCS has a relative concentration of 55% fructose, 45% glucose). These compounds, however, do not have their own metabolic pathways and must be first be transformed into molecules that can enter the glycolytic pathway. Fructose metabolism (occurring primarily in the liver) is of particular concern because the formation of the metabolites that enter the glycolytic pathway sidestep the regulatory action of the kinases. As a result, fructose metabolism is often uncontrolled and can contribute to a variety of metabolic diseases such as obesity, diabetes, and hypertension (Khitan & Kim, 2013). After the formation of the 1-6 fructose bisphosphate molecule, a subsequent series of reactions will transform it into two molecules of glyceraldehyde 3-phosphate: (G-3P). Following this a phosphate group is added to each of the G-3-P molecules which are then oxidized by NAD+ (nicotinamide adenine di nucleotide) to produce two molecules of 1-3-bisphosphyglycerate and two molecules of NADH. Each of the reduced molecules of NADH are high energy electron carriers. A series of enzymes will then catalyze the transfer of each of the phosphate groups from the two bisphosphoglycerate molecules to two molecules of ADP (Adenine di Phosphate) to produce a total of 4 molecules of ATP and two pyruvate molecules which ends the glycolytic pathway. Figure 2 (steps 6 -10) depicts the transformation of the G-3-P molecules to the final formation of pyruvate. Figure 2- G-3-P to Pyruvate Source: https://commons.wikimedia.org/wiki/File:Figure_07_02_02.jpg The final products of glycolysis are 4 molecules of ATP, two molecules of NADH and two molecules of pyruvate. These compounds are then transferred from the cytosol to the mitochondria where subsequent cycles of aerobic respiration produce the bulk of the organism’s supply of ATP. The transition to aerobic metabolism does not occur in all situations as many organisms (obligate anaerobes) live in anoxic environments and cannot withstand oxygen’s toxic effects. Facultative anaerobes are able to engage in aerobic metabolism but have the capacity of using anaerobic pathways when additional bursts of energy are needed or when oxygen supply becomes limited. oxygen supplies are limited. In each of these anaerobic environments, glycolysis is the only means of generating ATP. Glycolysis is, however, not an efficient metabolic strategy because it lacks an adequate supply of the electron carrying molecules needed to continually generate ATP. Metabolism through fermentation (lactic acid and alcohol) solves this problem by providing molecules that can shuttle electrons between compounds, which allows glycolysis to continue. These pathways will be analyzed at the end of the discussion of aerobic metabolism. The net energy produced by glycolysis is 2 molecules of ATP (4 total – 2 invested). While this may be sufficient for most one celled organism, it is not enough for more complex multicellular life forms that require greater amounts of energy. The additional energy (approximately 32 -36 molecules of ATP are generated through aerobic pathways within the mitochondria. Transition Phase To begin the process, the two pyruvate molecules formed at the end of glycolysis are converted by a series of enzymes and the addition of the compound Co-enzyme A into the acetyl CoA molecule. During the reaction NAD+ is reduced to NADH and a molecule of CO2 is released. Once formed, the molecules will diffuse from the cytosol into the mitochondrial matrix to begin the Krebs cycle. Figure shows the conversion of pyruvate into acetyl CoA. Figure 3- Pyruvate to Acetyl Co-A Source: https://commons.wikimedia.org/wiki/File:Pyruvate_dehydrogenase_complex_reaction.PNG Krebs Cycle (Citric Acid Cycle or tricarboxylic acid cycle): There are 8 major steps to this cycle that are catalyzed by 8 enzymes: the detailed chemistry of each reaction is however, beyond the scope of this unit. This discussion will focus on the oxidation / reduction reactions that generate ATP and produce the molecules (NADH, FADH), that carry electrons into the electron transport chain. A complete list of all relevant compounds and enzymes is located in the Appendix. Once the transition process is completed enzymes remove the acetyl group from acetyl Co-A molecule and attach it to a molecule of oxaloacetate. A series of reactions convert oxaloacetate first to citrate then into isocitrate. Isocitrate is oxidized by NAD+ to produce a ketoglutarate, (NADH +H) and a molecule of CO2. Figures 4 and 5 show the transition of oxaloacetate to a ketoglutarate. A subsequent oxidation by NAD+ will generate a second molecule of NADH and produce the compound succinyl- CoA. A phosphate group will displace Co-A and produce succinate; releasing a molecule of Guanosine triphosphate (GTP): (which will generate a molecule of ATP). Succinate is oxidized by FAD to produce fumarate: (FAD is reduced to FADH2). The transition from succinyl CoA through the oxidation of succinate is depicted in figures 6 and 7. A dehydration reaction converts fumarate to malate followed by a final oxidation by (NAD+ à NADH) to produce the molecule oxaloacetate. Oxaloacetate binds once again to an acetyl co-A molecule to restart the cycle. Figures 8 and 9 show these final steps. The net energy produced in the cycle is one ATP three NADH, and one FADH2. The total energy production is twice these amounts (2 ATP, 6 NADH, 2 FADH2) since two pyruvate molecules created at the end of glycolysis entered this cycle. This is however not a marked increase in the amount of energy produced in glycolysis. The electron transport chain is composed of a set of four proteins that are embedded in the inner membrane that separates the mitochondrial matrix from the mitochondria inter membrane space. These proteins channel electrons from the carrier molecules into the chain. The ATP synthase protein at the “end of the chain” uses protons entering from the intermembrane space to generate molecules of ATP. Following is a description of the chemical reactions in the chain. At the start of this process the compounds (NADH and FADH2) deliver their electrons into the protein channels of the transport chain. The electrons move down the chain as each successive protein has a higher affinity for electrons than the one before it. The passage of electrons through the proteins, drives pumps that move protons from the matrix into the intermembrane space which creates a higher concentration gradient in the intermembrane space than in the matrix. As a result, the protons in the intermembrane space will move with the gradient and reenter the matrix space through ATP synthase channel. The passage of each proton will drive and add a phosphate group to an ADP molecule generating an ATP. This process of chemiosmosis (also known as the proton motive force) continues as long as electrons are moving through the matrix. It is estimated that each glucose molecule can generate between 32 -36 molecules of ATP The last steps of the electron transport chain illustrate the importance of oxygen in aerobic metabolism. As noted in figure 8, electrons exiting the transport chain reenter the mitochondrial matrix where they split an oxygen molecule into separate oxygen atoms. The atoms then combine with hydrogen ions in the matrix to form water molecules. The overall reaction is ½ O2 + 2H + + 2e– à H2O Metabolism continues as long as there are oxygen atoms to accept electrons within the matrix. This is the reason that oxygen is essential to aerobic respiration for without it, electrons would not be able to move through the transport chain and metabolism would stop. In the absence of oxygen organisms can revert back to glycolysis to generate additional ATP, but this is a limited strategy as glycolysis depletes its supply of NAD+ molecules in the initial production of ATP. In order to continue metabolism, the organism needs to find a way to regenerate electron acceptor molecules of NAD+. Two processes that help replenish these important molecules are lactic acid and alcohol fermentation. Fermentative anaerobic metabolism: lactic acid fermentation These processes begin at the end of glycolysis which has produced 2 molecules of pyruvate, 2 (net) ATP molecules and 2 molecules of the coenzyme NADH. NADH is an important substance throughout metabolism as it not only carries electrons to each of the cycles, but it is continually recycled (through redox reactions) from NAD +(the oxidized form) to NADH (the reduced form). Initially NAD+ is reduced as it accepts two electrons and two hydrogen ions to become NADH. NAD+ + 2e– + 2 H+ (a Hydride ion) à NADH + H (NAD+ is reduced) In subsequent reactions the NADH is oxidized and transfers its proton and electrons to pyruvate molecules. NADH à NAD+ + 2e– (NADH is oxidized) The oxidation of NADH regenerates the NAD+ which is then able to accept additional electrons which allows metabolism to continue. This ability to accept and deliver electrons is essential in anaerobic processes because without a molecule that can accept electrons metabolism cannot proceed. Each of the following anaerobic pathways uses different processes to regenerate molecules of NAD+ which can be used as electron acceptors. Lactic acid fermentation is used by certain strains of bacteria or it can be used to supplement aerobic respiration in our bodies when oxygen supply to the cells runs low or when quick bursts of energy are needed. To start, pyruvate molecules formed at the end of glycolysis are converted by a series of enzymes to a molecule of lactate which at the same time oxidizes a molecule of NADH to NAD+ (see figure 11.) The NAD+ molecule; is then able to accept additional electrons thus allowing glycolysis to proceed once again. This process can continue until the lactic acid (lactate’s conjugate acid) begins to accumulate in the cells and the lactate threshold is reached. Lactate threshold is reached when concentration of lactic acid produce fatigue, muscle pain, and cramps. At this point, activity must cease until sufficient oxygen is taken in which reduces concentrations of lactic acid in the muscles. Lactobacillus bacteria metabolize lactose in milk using lactic acid fermentation to convert pyruvate into lactic acid. The acid then “sours” the milk to produce yogurt. Other foods such as sauerkraut, Kimchi, and pickles are also produced by bacteria using lactic acid fermentation. Yeasts and certain bacterial strains employ alcoholic fermentation as a means of regenerating NAD+ molecules. This process begins when the pyruvate molecules formed at the end of glycolysis are transformed (through the action of enzymes and pyruvate decarboxylase) into a molecule of acetaldehyde (see figure 12). Figure 12 – Pyruvate to Ethanol. Source: https://commons.wikimedia.org/wiki/File:Pyruvate_decarb_1.jpg This first step releases a molecule of carbon dioxide gas. The emitted gas is used in a variety of food applications; most notably in baking and carbonated alcoholic beverages. Following this first reaction, the enzyme alcohol dehydrogenase catalyzes the transfer of a hydride from NADH to the acetaldehyde producing a molecule of ethanol. In the process the NADH is oxidized to NAD+. The regenerated NAD+ molecule can then be used to accept electrons thus allowing glycolysis to continue. The ethanol produced in this last step is another important compound used in a variety of alcoholic food products (such as beer, wine, and gasoline additives). [1] Billion Years Ago [2] Million Years Ago [3] (The biochemistry and evolutionary history of the development of the eukaryotic cellular structure and its transition from autotroph to heterotroph is still not clearly understood (W. Martin et al., 2001), as such they are beyond the scope of this unit.)Theory? of Evolution
Evolutionary Mechanisms
The Great Oxygen Event
Mitochondria
Endosymbiosis
Evolution of Mitochondria and Their Hosts
Energy and metabolism
Metabolism and metabolic pathways
Glycolysis

Aerobic Metabolism

Electron transport Chain: Oxidative Phosphorylation
Importance of Oxygen
Anaerobic Metabolism
Lactic Acid Fermentation
Lactic Acid Fermentation in our Lives
Alcoholic Fermentations
HS-LS7-1 Use a model to illustrate that cellular respiration is a chemical process whereby the bonds of food molecules and oxygen molecules are broken and the bonds in new compounds are formed, resulting in a net transfer of energy HS-LS2-5 Develop a model to illustrate the role of photosynthesis and cellular respiration in the cycling of carbon among the biosphere, atmosphere, hydrosphere, and geosphere. HS-LS2-3. Construct and revise an explanation based on evidence for the cycling of matter and flow of energy in aerobic and anaerobic conditions. HS-LS4-4. Construct an explanation based on evidence for how natural selection leads to adaptation of populations. CCSS.ELA-LITERACY.RST.11-12.8 Evaluate the hypotheses, data, analysis, and conclusions in a science or technical text, verifying the data when possible and corroborating or challenging conclusions with other sources of information. CCSS.ELA-Literacy.RST.11-12.9 is a common core standard that asks student to synthesize information form a range of sources to create a coherent understanding of a phenomena or concept.STANDARDS
Next Generation Science Standards
Common Core Standards
This unit begins after students have studied types of chemical reactions and their applications in chemical and biological systems. Key reactions are photosynthesis, combustion, and redox reactions. Essential Question: What is the relationship between photosynthesis and cellular respiration? Objective: Students will compare photosynthesis and cellular respiration and the organelles (chloroplasts and mitochondrion) where they occur. Students will also analyze the carbon cycle and evaluate the processes that maintain or disrupt its balance. Standard: NGSS: HS-LS2-5. Matter and Energy in Organism and Ecosystems Common Core: CCSS.ELA-Literacy.RST.11-12.8 Activity: Students will relate the reactants and products in photosynthesis and cellular respiration to the organelles where they occur. Students will use questions to determine the source of energy in living organisms. Students will then relate these reactions to the carbon cycle and explain how these and other processes contribute to the cycle’s balance. A final analysis question will be what types of human activities disrupt the carbon balance. Essential Question: What is the role of natural selection in the evolution of color in the pocket mouse population? Objective: Students will explain the role of genetic variation, the environment, and natural selection in the evolution of color in desert pocket mouse populations. Standard: HS-LS4-4 Biological Evolution: Unity and Diversity Common Core: CCSS.ELA-Literacy.RST.11-12.9 Activity: Color Variations over time in Pocket Mouse Populations from HHMI interactive is located at: Students receive activity handout and materials (mouse color variation cards) to determine relative age of the various populations. Student activity handout: Student Handout: https://www.biointeractive.org/sites/default/files/MouseColorVar-StudentHO-act.pdf Once completed class will view “The Making of the Fittest: Natural Selection and Adaptation” video at: https://www.biointeractive.org/classroom-resources/making-fittest-natural-selection-and-adaptation Following video: Class will discuss analysis questions that analyze the research on the evolution of color in the pocket mouse populations: (Analysis questions are located in the teacher resources in the Appendix). Students will use information from video to determine the chronology of the evolution of color in mouse populations (oldest to most recent). Students will answer analysis questions and graph population data (on student activity handout). Students will complete activity with a written summary that explains how genetic mutations interact with environmental pressures to determine which populations survive in differing environments. To end activity class will read and discuss written summaries. Essential Question: How do aerobic and anaerobic metabolic reaction pathways differ? Objective: Students will analyze the pathways in cellular respiration. The POGIL will explore the reactions and molecules in aerobic respiration and anaerobic respiration (fermentation). Standard: HS-LS7-1: Matter and Energy in Organisms and Ecosystems Activity: Students will complete a Cellular Respiration POGIL to determine the reactants and products in glycolysis, the Krebs Cycle, and the electron transport chain. Students will determine the number ATP molecules produced in each phase. Students will then contrast these aerobic processes to anaerobic processes: (lactic acid and alcoholic fermentation). Essential Question: How does the concentration of sugar affect the rate of anaerobic respiration in yeast cells? Objective: Students will analyze the relationship between sugar concentration and rate of respiration in yeasts. Standard: HS-LS2-3. Matter and Energy in Organisms and Ecosystems Activity: Students will conduct a laboratory that measures the rate of respiration as a function of sucrose concentration in yeasts. Students will begin activity by answering a series of prelab questions that analyze the reactants and products in alcoholic fermentation. Once finished students will set up materials for the laboratory which will be concluded on Day Seven. Teacher should have all supplies available so lab can be completed during one period. Students will complete lab which measures activity of yeast cells. Students should be divided into groups of four so that each member of the group can carry out a different task as outlined in the lab procedures. Each group will share their data with the class so that a conclusion on the lab can be completed. Students will be responsible for writing a narrative summary of the lab that includes a description of the procedures and a detailed analysis of the lab results. Essential Question: How much heat energy (in kJ and Calories) is contained in food. Objective: Students will determine the heat content (in kJ and Calories) of representative food samples. Standard: HS-PS3-3 Energy Activity: Heat Content of Foods Laboratory. Students will burn given samples of foods in prepared calorimeters. Students will use digital thermometers to measure heat gain of a specific amount of water, then use the heat equations to calculate kJ of energy per gram of food sample. Students will then convert kJ to kilocalories. Detailed lab procedure is located in Appendix. Essential Question: How much energy (in calories) are needed to support your body’s basic metabolism? Objective: Students will calculate their Basal Metabolic Rate and determine the necessary number of calories needed to support their basal metabolism. Standard: HS- LS7-1: ENERGY Activity: Students will use guide sheet to calculate basal metabolic rate and caloric intake needed to maintain their BMR. Students will use the How Much Do I Need Activity Guide to calculate the necessary portions of food from four food groups to meet their required caloric intake. The “How Much Do I Need: Calories and Dietary Choices Activity: Guide is located in Appendix. Essential Question: How do the differing types of metabolism affect our daily lives? Objective: Students will research the various ways that metabolism my microorganisms affects our environment, our health, and the food products we consume. Standard: CCSS.ELA-Literacy.RST.11-12.9 Activity: Students will engage in independent research (or guided Web Quest) to determine the various ways that metabolism by microorganisms affect our everyday lives. Students will prepare a brief presentation that addresses the following: Type of organism, their environment, their metabolic pathway Detailed analysis of reactions (reactants and products) of their metabolic pathways Effects of their metabolism (products, environmental effects, health consequences, etc.) Modes of presentation the research will be determined by class. Students may make their presentations in person in class or digitally.Day One: Photosynthesis and Respiration POGIL
Day Two and Day Three: What is Natural Selection.
Day Three
Day Four: Cellular Respiration
Day Five and Day Six: Cellular Respiration in Yeast Lab: Adapted from I. Waldron
Day Six
Day 7 Heat Content of Foods Lab
Day 8 and Day 9
Day 9: Summary Research
Day 10: Presentation of Summary Research
Photosynthesis and Respiration POGIL: available at: (https://www.d11.org/cms/lib/CO02201641/Centricity/Domain/3296/14%20Photosynthesis%20and%20Respiration-S.pdf) Color Variations over time in Pocket Mouse Populations from HHMI interactive is located at: Educator materials https://www.biointeractive.org/sites/default/files/MouseColorVar-Educator-act.pdf Link to Activity Cards: https://www.biointeractive.org/classroom-resources/making-fittest-natural-selection-and-adaptation Additional activities on Natural Selection from HHMI are available at: https://www.biointeractive.org/classroom-resources?f%5B0%5D=topics%3A59 Cellular Respiration POGIL: available at: https://www.commackschools.org/Downloads/Cellular%20Respiration%20POGIL.pdf Respiration of Yeast Lab by Ingrid Waldron / Jennifer Dougherty at: https://www.ngsslifescience.com/science.php/biology/lessontypes/Experiment/P10 Teacher Notes: (https://serendipstudio.org/sci_edu/waldron/pdf/YeastTeachPrep.pdf) Student Handout (https://serendipstudio.org/sci_edu/waldron/pdf/YeastProtocol.pdf) Basal Metabolic Rate Worksheet (http://pchs.psd202.org/documents/cflorenc/1562601589.pdf) Metabolism Food Label Lunch Lab (https://www.ngsslifescience.com/science.php/biology/lessontypes/Experiment) Procedure: Making the Food Holder: Main Procedure: Hang this rod over the ring on the ring stand. Use a second ring to stabilize the can during the experiment. This ring should be around the middle of the can. When placing the can make sure that the bottom of the can is at least 2.5 cm from the food sample. Table 1 Calculations: q = (Cp)*(m)(DT). (Cp) is the specific heat capacity of water: 4.18 J/g-OC or (1 Cal / g-OC): (m) is the mass of the water: (DT) is the change in temperature. Conclusion questions Basal Metabolic Rate Worksheet: (Source) http://pchs.psd202.org/documents/cflorenc/1562601589.pdf Most people can have a successful healthy diet just by estimating their quantity of food and timing their meals equally throughout the day. Until you get used to a new diet regimen though, you may need to weigh some foods at first to grasp the idea of what one cup looks like and what ‘two ounces of salad dressing’ is in your bowl . Most people, at first, will overestimate and therefore over consume. Your Basal metabolic Rate (BMR) is the rate at which your body uses energy while at rest to keep vital functions going, such as breathing and keeping warm. It is a good formula to work into your diet regimen to understand how much fuel you need to survive. Here is the formula: Women: BMR = 655 + (4.35 x weight in lbs. ) + (4.7 x height in inches ) – (4.7 x age in years ) 655 + ________________ + _________________ – _______________ = BMR __________ Men: BMR = 66 + (6.23 x weight in pounds ) + (12.7 x height in inches ) – (6.8 x age in year ) 66 + ________________ + _________________ – _______________ = BMR_____________ This formula uses the variables of height, weight, age and gender to calculate the BMR. This is a good formula because it is more accurate than calculating calorie needs based on body weight alone. The only factor that is omitted is lean body mass (the ratio of muscle to fat that a body has). So, the leaner a body is the more calories it needs than heavier ones. This equation is very accurate but be aware that more muscular people will underestimate their caloric needs and very obese people will overestimate their caloric needs. Once you know your BMR you need to calculate your daily caloric needs based on your activity level. The Harris Benedict Equation, used below, has been found to be very accurate. To determine your total daily calorie needs, multiply your BMR by the appropriate activity factor, as follows. BMR X activity level = daily caloric needs to maintain current weight. _______ X ________ = _________________DAILY CALORIC NEEDS to maintain current weight. (A slight caloric deficit is required for weight loss. Do not exceed more than a 500-calorie deficit per day until you’ve reached your weight loss goals. Once you’ve reached your goal weight you will need to recalculate the above formulas.) Protein Intake (15% of total calories): daily caloric intake x .15 = protein in calories ______________ X .15 = _____________ protein calories per day Carb Intake (60% of total calories): daily caloric intake x .60 = carbs intake in calories ______________ x .60 = ___________________ carbohydrates per day in calories FAT INTAKE (25% of total calories): Daily caloric intake x .25 = fat intake in calories _______________ x .25 = ________________ of fat calories per day in calories per day How Much Do I Need Activity Guide: Adapted from Drexel University: Eat Right Now Lesson Plan: Source: https://deptapp08.drexel.edu/nutritioneducation/Website_Materials/FY17%20Curriculum/DRX%20HS%20Eval%20Lesson%20Plan%20Energy%207%2016.pdf How Much Do I Need? Name ___________________________________________________ Date _____________ Directions: Read the descriptions of the activity levels below and decide which one best describes you. Then look at the chart to see how many calories you need daily based on your activity level. Sedentary: Doing only the light physical activity associated with typical day-to-day life, such as taking a shower, getting dressed, and taking the bus to school. Example: Someone who sits most of the day doing activities such as riding in a bus or car, watching TV, playing video games, or using a computer. Moderately Active: Doing physical activity equivalent to walking 1.5 to 3 miles a day at 3 to 4 miles per hour, in addition to the light physical activity associated with typical day-to-day life. Example: Someone who bikes for half an hour a day but doesn’t break a sweat. Active: Doing physical activity equivalent to walking more than 3 miles a day at 3 to 4 miles per hour, in addition to the light physical activity associated with typical day-to-day life. Example: Someone on a basketball team. *Males: use the lower end of the range if you are younger and use the upper end of the range if you are older My daily calorie needs:_______________________ Directions: Now look at the chart below to see how much you need from each food group based on your calorie level. Circle the row with the amounts that you need. MyPlate Amounts by Calorie Level Plan a Menu for a Day Name ___________________________________________________ Date _____________ Directions: Using the Basal Metabolism worksheet, fill in the number of calories you need daily and the number of servings you need from each food group (or use the standard amount for 2000 calories). Then, in the second table check (—) off the foods you would eat in order to meet the needs listed in the first table. If you want a larger portion than what is listed, use more than one check (—) mark. For example, if you need to use 2 slices of bread for a sandwich, put two —— next to bread. ____ 5 whole-wheat crackers (1 oz. eq.) ____ 1 slice white bread (1 oz. eq.) ____ 1 slice of whole-wheat bread (1 oz. eq.) ____ 1 cup of whole-grain cereal (1 oz. eq.) ____ ½ cup brown rice (1 oz. eq.) ____ 1 cup of noodles (2 oz. eq.) ____ 1 a hamburger bun (2 oz. eq.) ____ 3 cups of popcorn (1 oz. eq.) ____ 1 large ear of corn (1 cup eq.) ____ 1 medium baked potato (1 cup eq.) ____ 1 cup cooked greens (1 cup eq.) ____ 3 broccoli spears (1 cup eq.) ____ 1 large sweet potato (1 cup eq.) ____ ½ cup vegetable juice (½ cup eq.) ____ 1 cup chopped lettuce (½ cup eq.) ____ 1 large orange (1 cup eq.) ____ 1 cup of canned peaches (1 cup eq.) ____ 1 cup 100% orange juice (1 cup eq.) ____ 1 small wedge of watermelon (1 cup eq.) ____ 1 medium wedge of cantaloupe (½ cup eq.) ____ 1 small boxes of raisins (½ cup eq.) ____ 1 cup fat free milk (1 cup eq.) ____ 2 oz. of low-fat American cheese (1 cup eq.) ____ 1 ½ oz of cheddar cheese (1 cup eq.) ____ 1 ½ cup of light ice cream (1 cup eq.) ____ 1 cup of low-fat yogurt (½ cup eq.) ____ 1 cup of 1% milk or 2% milk (1 cup eq.) ____ 1 cup split pea soup (2 oz. eq.) ____ 1 small chicken breast half (3 oz. eq.) ____ 1 small lean hamburger (3 oz. eq.) ____ 1 egg (1 oz. eq.) ____ 1 tablespoon peanut butter (1 oz. eq.) ____ ¼ cup of black beans (1 oz. eq.) ____ 1 sandwich slice of turkey (1 oz. eq.) Archibald, J. M. (2015). Current Biology Endosymbiosis and Eukaryotic Cell Evolution. Current Biology, 25, R911–R921. https://doi.org/10.1016/j.cub.2015.07.055 Ettema, T. (2016). Mitochondria in the second act Dawn of a new astronomy. Nature, 531, 39–40. Fischer, W. W., & Valentine, J. S. (2019, August 20). How did life come to tolerate and thrive in an oxygenated world? Free Radical Biology and Medicine. Elsevier Inc. https://doi.org/10.1016/j.freeradbiomed.2019.07.021 Gray, M. W. (2012). Mitochondrial evolution. Cold Spring Harbor Perspectives in Biology, 4(9). https://doi.org/10.1101/cshperspect.a011403 Gregory, T. R. (2009). Understanding Natural Selection: Essential Concepts and Common Misconceptions. Evolution: Education and Outreach, 2(2), 156–175. https://doi.org/10.1007/s12052-009-0128-1 Khitan, Z., & Kim, D. H. (2013). Fructose: A Key Factor in the Development of Metabolic Syndrome and Hypertension. Journal of Nutrition and Metabolism, 2013. https://doi.org/10.1155/2013/682673 Lyons, T. W., Reinhard, C. T., & Planavsky, N. J. (2014). The rise of oxygen in Earth’s early ocean and atmosphere. Nature, 506(7488), 307–315. https://doi.org/10.1038/nature13068 Martin, W. F., Garg, S., & Zimorski, V. (2015). Endosymbiotic theories for eukaryote origin. Philosophical Transactions of the Royal Society B: Biological Sciences, 370(1678), 20140330. https://doi.org/10.1098/rstb.2014.0330 Martin, W., Hoffmeister, M., Rotte, C., & Henze, K. (2001). An overview of endosymbiotic models for the origins of eukaryotes, their ATP-producing organelles (mitochondria and hydrogenosomes), and their heterotrophic lifestyle. Biological Chemistry, 382(11), 1521–1539. https://doi.org/10.1515/BC.2001.187 Martin, William, & Marek, M. (2010). The origin of mitochondria. Nature Education, 3(9), 58. Retrieved from https://www.nature.com/scitable/topicpage/the-origin-of-mitochondria-14232356/#url Millstein, R. (2019). Evolution. Retrieved April 27, 2020, from https://plato.stanford.edu/entries/evolution/#DefiEvol Rothschild, L. J. (2008). The evolution of photosynthesis…again? Philosophical Transactions of the Royal Society B: Biological Sciences, 363(1504), 2787–2801. https://doi.org/10.1098/rstb.2008.0056 Van Der Giezen, M. (2009). Hydrogenosomes and mitosomes: Conservation and evolution of functions1. Journal of Eukaryotic Microbiology, 56(3), 221–231. https://doi.org/10.1111/j.1550-7408.2009.00407.x Zimorski, V., Mentel, M., Tielens, A. G. M., & Martin, W. F. (2019). Energy metabolism in anaerobic eukaryotes and Earth’s late oxygenation. Free Radical Biology and Medicine, 140(November 2018), 279–294. https://doi.org/10.1016/j.freeradbiomed.2019.03.030Teacher Resources
Energy Content of Food Lab
Food sample
Initial mass of food and holder
Final mass of food and holder
Mass of food burned
Mass of container and water
Mass of empty container
Mass of the heated water
Final temperature of the water (Tf)
Initial temperature of the water (Ti)
Temperature change (D T) (Tf – Ti)
Heat, q, in J (and Calories)
Energy content in J/g food
Energy content in Calorie/g food
Activity Level
Gender
Age
Sedentary
Moderately Active
Active
Female
14-18
1800 calories
2000 calories
2400 calories
Male
14-18
2000-2400 calories
2400-2800 calories
2800-3200 calories
Calories
Grains
Vegetables
Fruit
Dairy
Protein
1800
6 ounces
2.5 cups
1.5 cups
3 cups
5 ounces
2000
6 ounces
2 ½ cups
2 cups
3 cups
5 ½ ounces
2200
7 ounces
3 cups
2 cups
3 cups
6 ounces
2400
8 ounces
3 cups
2 cups
3 cups
6 ½ ounces
2600
9 ounces
3 ½ cups
2 cups
3 cups
6 ½ ounces
2800
10 ounces
3 ½ cups
2 ½ cups
3 cups
7 ounces
3000
10 ounces
4 cups
2 ½ cups
3 cups
7 ounces
3200
10 ounces
4 cups
2 ½ cups
3 cups
7 ounces
Calories
Grains
Vegetables
Fruit
Dairy
Protein
2000
6 ounces
2 ½ cups
2 cups
3 cups
5 ½ ounces
Grains
Vegetables
____ 1 slice whole-wheat toast (1 oz. eq.)
____ 6 baby carrots (½ cup eq.)
Fruit
Dairy
____ 1 small apple (1 cup eq.)
____ ½ cup low fat cottage cheese (¼ cup eq.)
Protein
____ 1 oz nuts (2 oz. eq.)
BIBLIOGRAPHY

