Social:

Author: Cara Wallin
School/Organization:
Shawmont Elementary School
Year: 2016
Seminar: Our Earth, A Fragile Home
Grade Level: 6
Keywords: climate change, global warming, greenhouse effect, landfills, methane gas
School Subject(s): Environmental Science, Math, Science
Our Earth, our fragile home, has been experiencing many changes in its climate and environment over the past century. The evidence in these changes can been seen by studying the weather, oceans, and our ecosystems. Since the 1800s, our temperature has increased by an average of more than 1.5 degrees Fahrenheit. Although there are some natural causes for this change, humans have a huge impact on this problem. We, as humans, are releasing tons and tons of Carbon Dioxide and Methane, which are the two major greenhouse gases, also know as GHG. These greenhouse gases (GHG) are getting trapped in our Earth’s atmosphere with nowhere to go, in return causing the temperatures and weather patterns to change. This change to our society is usually referred to as global warming, the greenhouse effect, and climate change.
Students will take two- three weeks around Earth Day to study the many aspects around this issue, in particular, what effects our waste has on climate change. Students will practice using different instruments in order to collect and record data from the weather. They will have to compare and contrast the weather recorded previously in history. Once they see how much our daily weather has changed over 50 years, students will then look into the causes of our climate change, mainly focusing on what we do with our waste. By the end of this unit, students will have to work together to create possible solutions that they can incorporate to their everyday lives, in order to help our global situation.
Download Unit: 16.03.07-unit.pdf
Did you try this unit in your classroom? Give us your feedback here.
Nowadays, our curriculum is so focused on only what is tested, but as a teacher, I believe it is imperative that my students are educated on what is going on around them. Climate change is a great topic for students to study because it integrates so many subjects. It touches on various sciences such as: environmental, biology, chemistry, geography, etc. Besides the science standards, this topic requires students to use analytical tools and math skills to exercise their abilities to research, think, and understand complex issues.
This unit is intended for students in Grade 6. This sixth grade is an inclusion classroom with 28 students. The students cycle once in the first half of the day. One sixth grade teacher teaches literacy and social studies, while I teach math and science. The students have a 45-minute lunch, along with a 45-minute prep in the morning, which includes the following: music, computer, gym, and School Academic Music Program. The Objectives of the unit will include the following: Science Math This unit will take approximately two weeks. The activities are intended to be cross- curricula, including mathematics, social studies, and science.
This unit will contain age- appropriate activities that will be included cross- curricular in both science and mathematics. Lessons will be differentiated to meet IEP learning goals and reach every student. Students will access a wide variety of sources, including web, text, videos, and art in order for students to get a deeper understanding of the difference between weather and climate and the effects that it has on our earth. Students will do research and hands-on activities to help them better understand these concepts, both mathematically and scientifically. Hopefully, with these strategies, they will also be able to apply their new found knowledge to innovate ways that they can help protect our Earth now and for their future. Blended Learning As educators teaching students in the 21st century, it is imperative that we incorporate technology in their learning environment and experiences. In a blended learning environment, students will learn partially through face- to- face instruction and the other part will allow students to complete or research necessary items through their own navigation of online media. Students will be given guidelines and general timelines to complete the task at hand, but they will also have some control of how they go about completing the task. Journal Reflections Within this two-week curriculum unit, students will engage in journaling. At the beginning of every class, students will be given a picture, it could be of a landfill, and animal who lives in the arctic, different mines, etc. Each journal will include a brief and general description, along with prompts and questions to help guide the students in creating their own thoughts and opinions. The students will be given five to ten minutes to write freely in response to the prompt. This strategy allows students to integrate the knowledge they have learned in previous classes about the climate change, as well as the knowledge the students have attained from their day-to- day life. Journaling helps document the students’ growth throughout the curriculum unit and it will allow students to record questions or interesting facts. Setting this activity at the beginning of each lesson ensures that the students are reflecting and focusing on the topic at hand, so that they are ready for the lesson ahead. Choice Boards One of my main objectives as a teacher is to encourage and guide students to become independent learners. Students need to take ownership of their learning process and the activities they complete. Choice boards are an excellent strategy, which gives the students an active role in their learning by giving the student options. For a choice board, the teacher first has to determine the objective. Once the objective and purpose have been established, the teacher will choose activities, which help reach the outcome of the designated objective. There should be a wide variety of activities that will inspire the many different types of learners within the classroom. The choices will then be visually represented to the students, whether in words, or by examples. Students will then be given the direction to choose one, or more than one activity that is consistent with their needs. With this strategy, it allows students to choose a project or activity that they are interested in, which will result in a better product and comprehension. Differentiation In a classroom there are many types of learners. Each student comes to class with different cultural backgrounds, academic backgrounds, interests, learning styles, etc. It is important to differentiate the content, instruction, and student products in order to ensure the success of all students. Differentiation is the matching of appropriately challenging curriculum and instruction with a student’s ability, interests, and learning styles through a variety of activities, strategies, and material (“Differentiation”). In this curriculum unit, all students will be learning the same content, but each student’s needs will be addressed throughout the unit. Students will show their understanding in a variety of ways that is personal to their needs. Lessons will ensure to challenge students through tiered activities and higher order questioning. With planning, differentiation will help each child accelerate as a life long learner, while reaching the goal of each objective for the unit. Comparing and Contrasting (Venn Diagrams) This unit focuses on the changes that our Earth has undergone from the past to the present. Using the strategy of comparing and contrasting will encourage students to identify the similarities and differences of our climate from 100 years ago to today. Students will be able to classify the information being taught, which will help them recognize what the past and present have in common, along with pinpointing what is different. Students will be looking at both statistics, which will include sea level, temperature, emissions, etc. Having students classify the similarities and differences will help them think deeper as to what is causing these changes and how we might be able to stop them. Share- Alouds
Lesson 1: Understanding the difference between climate and weather Time: One 45- minute social studies/science block Objectives: Materials: Procedure: Lesson 2: Landfills and Waste Management: Recycle, Reuse, or Place in a Landfill Time: One 45- minute social studies/science block Objectives: Materials: Procedure: Students will start the lesson with a reflection journal. This journal has a list of items found in landfills and how long it takes them to decompose. After a brief discussion with the journal, each group of students will be given a pre-made waste basket with commonly disposed of items. As a group, students will dig through the trash and make a list of the items they found. Once the items are identified, students will then sort through the items and decide whether the items should be recycled, reused, or placed in a landfill. Lesson 3: Landfills and Waste Management Time: One 45- minute social studies/ science block Objectives: Materials: Procedure: Students will complete journal reflection and share their thoughts on the picture. Students will watch a short video clip how landfills work. Lesson 4: Landfills Time: Two 45- minute social studies/science block Objectives: Materials: Procedure: Students will start the lesson with a journal reflection. Students will use the knowledge they have learned thus far to come up with reasons as to why ice is diminishing by 287 billion metric tons per year. Students will create a sequence chart/ timeline of the processes of landfills. Day 1: Students can watch the following video: http://study.com/academy/lesson/sanitary-landfills-definition-and-issues.html After watching the video, there is an interactive quiz/ questions that they can answer independently or collectively. Will show the set- up of landfill and the types of pollution it creates. Day 2: Water Pollution: Hands- On Activity: In the previous lesson, students will have watched a video on landfills. In this activity, students will gain a deeper knowledge of the problems with landfills by creating their own landfill liner. You may groups students together, with as many or as little students as you may like. Each group will be given a trash bag and duct tape. Instruct them to make a plastic bag that can hold one cup of water without leaking. Ask the students to think about why a bag might leak while making their designs. To test the bags, have one student hold the bag over a large beaker or measuring cup. Have the teacher or another student pour exactly one cup of water into the constructed plastic bag. Time one minute and then measure the water that leaked through the bag. Have students record their data on paper or on the board. Ask students to imagine trying to design the same type of liner for a landfill the size of a football field or larger. Would it leak? You can make this into a class competition. Lesson 5: Project Time: Approximately 1 week (5 90- minute math blocks) Objectives: Materials: Procedure: This is a project that will integrate math and social studies. Students will be able to follow the criteria located on the Climate Change outline located in Appendix D. Students will use the website listed above to collect the temperature for a specific location over the past 50 years. With this data, students will be able to find the mean, median, and mode. With this information they will be able to create line plots and histograms and will be able to write quantitative analysis.
Crashcoursekids. “Weather vs. Climate: Crash Course Kids #28.1.”YouTube. YouTube, 23 Sept. 2015. Web. 03 May 2016. “Historical Weather.” Weather History & Data Archive. Web. 17 June 2016. “Landfills And The Environmental Effects.” Live Life Green. 6 Aug. 2009. Web. 03 May 2016. “Newsletter.” Peace Research 37.1 (2005): 1-10. JSTOR. Web. 03 May 2016. PearsonBio. “Video Field Trip – Landfill.” YouTube. YouTube, 24 Mar. 2010. Web. 03 May 2016. “Public Health, Safety, and the Environment.” Frequent Questions:. Web. 03 May 2016. “Quizlet.” Climate Change Vocabulary Flashcards. Web. 17 June 2016. RecycleStuffCDR. “Kids Talkin’ Trash (Part 1 of 2).” YouTube. YouTube, 05 July 2011. Web. 03 May 2016. “Sanitary Landfills.” Study. Web. 17 June 2016.
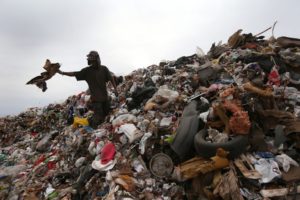
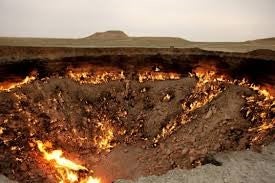
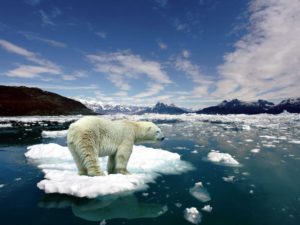
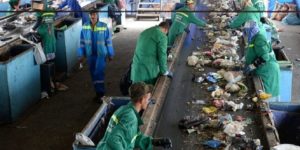
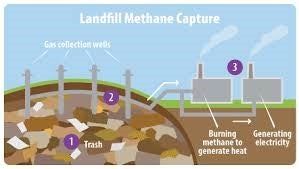
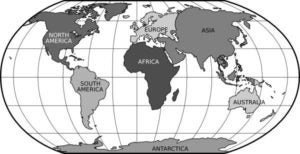
Appendix A Name ___________________________________ Date ___________________ Journal 1 Think about what you dispose (throw away) of each and every day then think of what you actually put in recycling bins. Take a look at the table and write a reflection which will incorporate what surprises you? What concerns do you have? What questions do you have? ________________________________________________________________________ ________________________________________________________________________ ________________________________________________________________________ ________________________________________________________________________ ________________________________________________________________________ ________________________________________________________________________ ________________________________________________________________________ ________________________________________________________________________ ________________________________________________________________________ Name ___________________________________ Date __________________ Journal 2 John Moore / Getty Images The average person throws away 4.5 pounds of trash a day. This is a picture of a landfill that is located in Nogales Landfill, Mexico. Take a good look at the different items you can see in the landfill and reflect on the table form yesterday’s journal with how long it takes certain items to decompose. Write a reflection on your thoughts, opinions, concerns, etc. ________________________________________________________________________________________________________________________________________________________________________________________________________________________________________________________________________________________________________________________________________________________________________________________________________________________________________________________________________________________________________________________ Name __________________________________ Date ____________________ Journal 3 Landfills that do not cover their waste with a daily cover, such as soil, allows the decomposition of material to get extremely hot and cause spontaneous combustion. These fires that occur in landfills can last months to even years and take millions of dollars to extinguish. What health and environmental concerns do you think this brings about? ________________________________________________________________________________________________________________________________________________________________________________________________________________________________________________________________________________________________________________________________________________________________________________________________________________________________________________________________________________________________________________________________________________________________________________________________________________________________________________________________________________________________________________________________________________ Name ___________________________________ Date _________________________ Journal 4 Ice on land is diminishing by 287 billion metric tons per year. Think about the videos and discussions we have had. What do you believe is one of the root causes of this? ________________________________________________________________________________________________________________________________________________________________________________________________________________________________________________________________________________________________________________________________________________________________________________________________________________________________________________________________________________________________________________________________________________________________________________________________________________________________________________________________________ Name ____________________________________ Date _________________ Journal 5 This is a picture of a recycling plant. Knowing that paper takes 2-5 months to decompose, plastic bottles take roughly 450 years to decompose and aluminum cans take between 80- 200 years to decompose. Why is it so important that we take recycling more serious? ________________________________________________________________________ ________________________________________________________________________ ________________________________________________________________________ ________________________________________________________________________ ________________________________________________________________________ ________________________________________________________________________ ________________________________________________________________________ ________________________________________________________________________ ______________________________________________________________________ Name ____________________________________ Date _______________________ Journal 5 Landfill gas is made of about 50% methane gas. Engineers have come up with a solution of our pollution from both landfills and burning fossil fuels. They have created a landfill that now traps the methane gas from the landfill and is burned to generate electricity. How or why is this helpful in tackling climate change? What else could we do? Think outside of the box. _______________________________________________________________________________________________________________________________________________________________________________________________________________________________________________________________________________________________________________________________________________________________________________________________________________________________________________________________________________________________________________________________________________________________________________________________________________________________________________________________________________________________________________________________________________ Appendix B Venn Diagram Appendix C Weather and Climate Project Name___________________________________ Date _________________________ SWBAT collect quantitative data IOT identify the different effects of climate change. North Hemisphere City, State, Country __________________________________________________________________ Southern Hemisphere City, State, Country __________________________________________________________________ Hint: What is the date of your birth? (For example, my birthday is December 20, therefore pick the 20th as the date. I would look up January 20, 1955, February 20, 1955, March 20, 1955…. January 20, 2015) __________________________ On the attached table, please list the temperatures for the date of each month of each year for the past 60 years. Month you were born is __________________________ City you chose is __________________________ Month before your birthday is _________________________ The month after your birthday is _________________________ Rubric for Weather and Climate Project Name of Student _________________________ City, State, Country _______________________________________________ Comments _______________________________________________________________________ _______________________________________________________________________________________________________________________________________________________________________________________________________________________________________________________________________________________________ Appendix D
Item
Years to Decompose
Item
Years to Decompose
Glass Bottle
1 million years
Foam cups
50 years
Aluminum Can
80- 200 years
Plastic Bag
10- 20 years
Plastic Bottle
450 years
Paper Towel
2-4 weeks
Tire
80 years
Plywood
1-3 years
Milk Carton
3 Months
Apple Core
2 months
Newspaper
6 weeks
Orange/ Banana Peel
2-5 weeks
Leather
50 years
Paper
2- 5 months
Data
/15
Mean, Median, and Mode
/10
Quantitative Analysis
/10
Climate Information
/10
Natural Disasters
/10
Box- and- Whiskers
/15
Line Graphs
/15
Stem- and- Leaf Plots
/15
January
February
March
April
May
June
July
August
September
October
November
December
January
February
March
April
May
June
July
August
September
October
November
December
January
February
March
April
May
June
July
August
September
October
November
December
Math Science